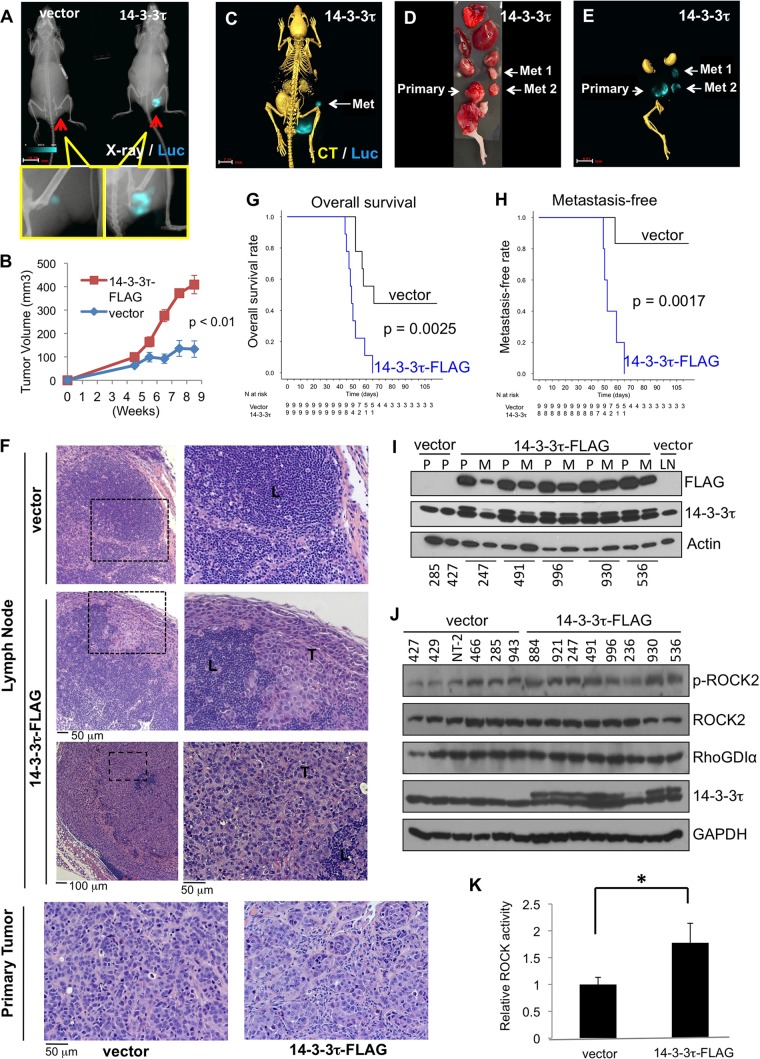
FIG 8.
14-3-3τ promotes MCF7 xenograft invasion and metastasis. (A) A representative image of a multimodality longitudinal imaging study of 14-3-3τ–FLAG or vector control MCF7 xenograft. X-ray and luciferase images are shown. Bar, 10.20 mm. (B) Tumor volumes of control and 14-3-3τ-overexpressing MCF7 xenografts (n = 9 for each group). (C) Bioluminescence–X-ray–CT imaging of MCF7-Luc mammary fat pad xenografts in nude mice. Bar, 7.25 mm. (D and E) Ex vivo imaging of primary and metastatic 14-3-3τ–FLAG MCF7 tumors. Bar (E), 9.61 mm. (F) H&E staining of metastatic lymph nodes from 14-3-3τ-overexpressing MCF7 xenograft mice and primary tumors from control and 14-3-3τ-overexpressing MCF7 xenografts (20× objective lens). L, lymphocytes; T, tumor cells. (G) Kaplan-Meier curves of survival of the tumor-bearing mice after injection of cells (n = 9 for both groups). The P value between both groups (log rank test) is indicated. (H) Kaplan-Meier curves of metastasis-free rate (n = 9 for control; n = 8 for 14-3-3τ–FLAG; one 14-3-3τ–FLAG xenograft-bearing mouse died over the weekend and was not available for ex vivo bioluminescence imaging). P value between both groups (log rank test) is indicated. (I) Immunoblots of primary (P) and metastatic (M) tumors. The number below each lane is the xenograft identification number in our experiment. LN, lymph nodes. (J) Immunoblots of primary tumors from both the control MCF7 group and the 14-3-3τ–FLAG-expressing MCF7 group. The number above each lane is the xenograft identification number in our experiment. (K) The pS1366-ROCK2 and ROCK2 signals from each xenograft were measured by densitometry using the NIH program ImageJ, and the pS1366-ROCK2 signal was normalized by its respective ROCK2 signal to reflect ROCK activity. *, P < 0.001 (two-tailed t test).

