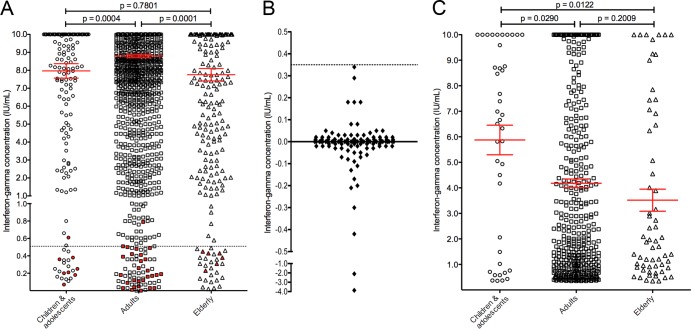
FIG 2.
(A) Interferon gamma concentrations in the positive-control sample according to age group (n = 3,263). Mann Whitney U test P values are shown above the chart. The red lines indicate the mean and the standard error of the mean. Results from immunocompromised patients (i.e., those with known immunodeficiency or on immunosuppressive therapy) are highlighted as red circles, squares, and triangles. The dotted line indicates an interferon gamma concentration of 0.5 IU/ml. (B) Background-corrected interferon gamma responses in patients with indeterminate QFT-GIT results resulting from failed positive controls (n = 114). The dotted line indicates an interferon gamma concentration of 0.35 IU/ml. (C) Interferon gamma concentrations in the antigen-stimulated sample (uncorrected) in patients with a positive QuantiFERON-TB Gold In-Tube assay result according to age group (n = 562). Mann Whitney U test P values are shown above the chart. The red lines indicate the mean and the standard error of the mean.

