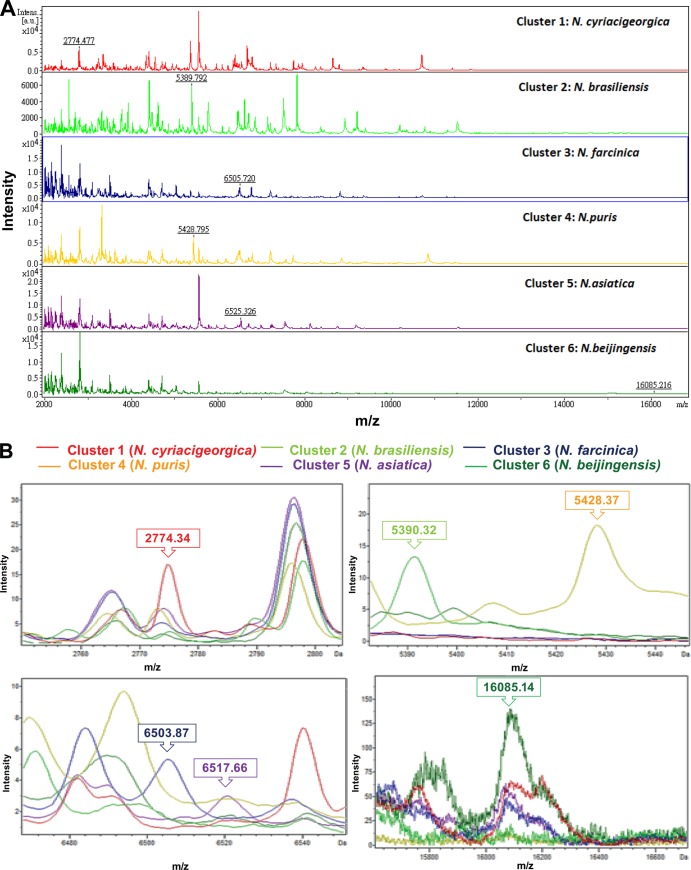
FIG 1.
Clustering analysis of spectra generated by the Bruker Biotyper MALDI-TOF MS system for six common Nocardia species with poor identification performance or absence in the Bruker Biotyper database. (A) Six clusters of Nocardia species spectra, i.e., cluster 1, N. cyriacigeorgica; cluster 2, N. brasiliensis; cluster 3, N. farcinica; cluster 4, N. puris; cluster 5, N. asiatica; and cluster 6, N. beijingensis. (B) The six peaks (indicated by numbers and arrows) used to define the six clusters which were generated by ClinProTools with the genetic algorithm are m/z 2,774.477 (cluster 1), m/z 5,389.792 (cluster 2), m/z 6,505.720 (cluster 3), m/z 5,428.795 (cluster 4), m/z 6,525.326 (cluster 5), and m/z 16,085.216 (cluster 6). The absolute intensities of the ions are shown on the y axis, and the masses (m/z) of the ions are shown on the x axis. The m/z values represent the mass-to-charge ratio.

