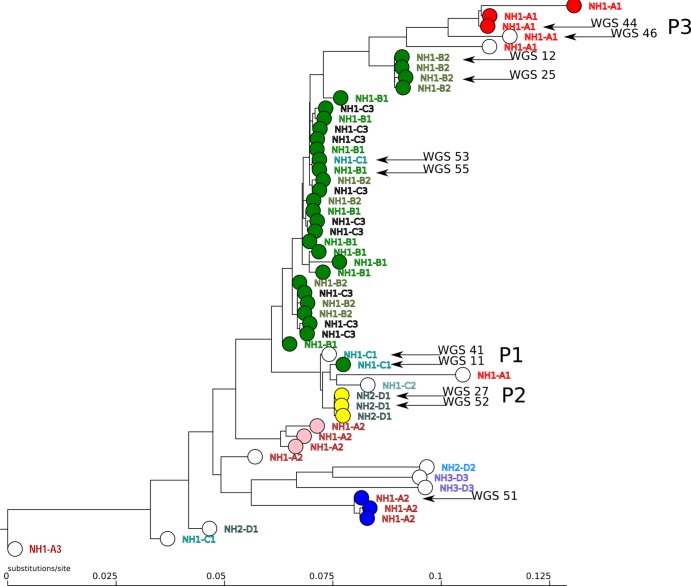
FIG 2.
Phylogenetic tree generated by the HAI BioDetection system in combination with AFLP results. The five AFLP clusters are indicated by colors for each isolate. Isolates considered unique by AFLP are indicated in white. The location of residence (nursing home location NH1 and NH2, building A, B, C, or D, or Department 1, 2, or 3) is indicated in capitals to the right of each circle representing an isolate. Arrows indicate isolates for which whole-genome sequencing was performed. P1, P2, and P3 refer to patients 1, 2, and 3. The scale at the bottom indicates substitutions per site relative to the 10 kb of sequence included in the analysis by the kit.

