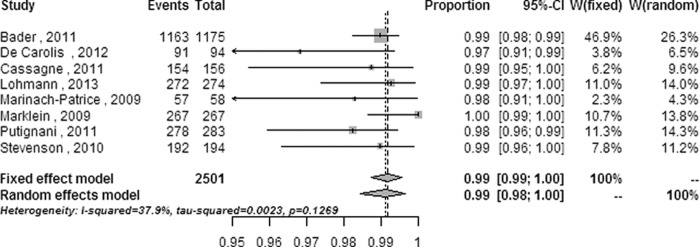
FIG 4.

Forest plot for the subanalysis of modified outcomes from the Biotyper system at the species level. CI, confidence interval; W, weight; fixed, fixed-effect model; random, random-effects model; events, number of correct identifications; total, total number of identifications.
