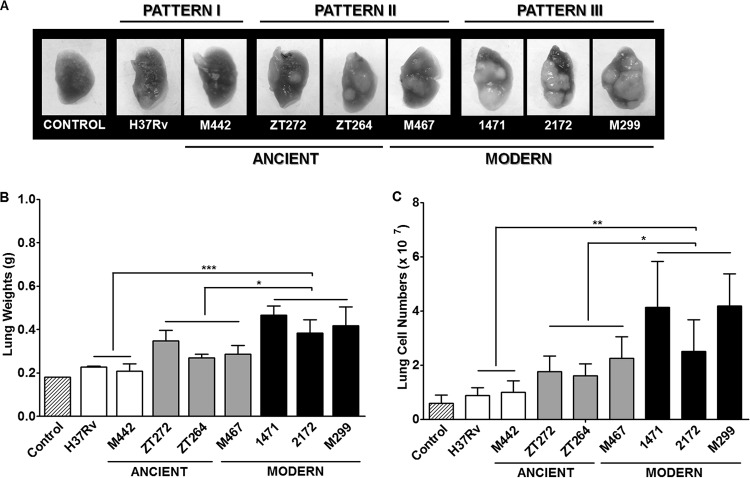
FIG 4.
Macropathological changes in the lungs of M. tuberculosis-infected mice. C57BL/6 mice were i.t. infected with 102 bacilli of each strain, and lungs were examined 28 days p.i. (A) Representative macroscopic lung images demonstrating gross pathology, observed as numerous giant inflammatory lesions (white nodes of different size). (B and C) Lung weights (B) and numbers of cells obtained from lungs after mechanical and enzymatic tissue disruption (C). Results of at least three experiments (three mice in each group in each experiment). Data represent means plus standard deviations (SD) (error bars). Significant differences were determined between the groups of pattern III strains (black columns), pattern II strains (gray columns), and pattern I strains (white columns). Values that are significantly different for the different groups of strains (groups with different patterns) are indicated by asterisks as follows: *, P < 0.05; **, P < 0.01; ***, P < 0.001.

