
FIG 2.
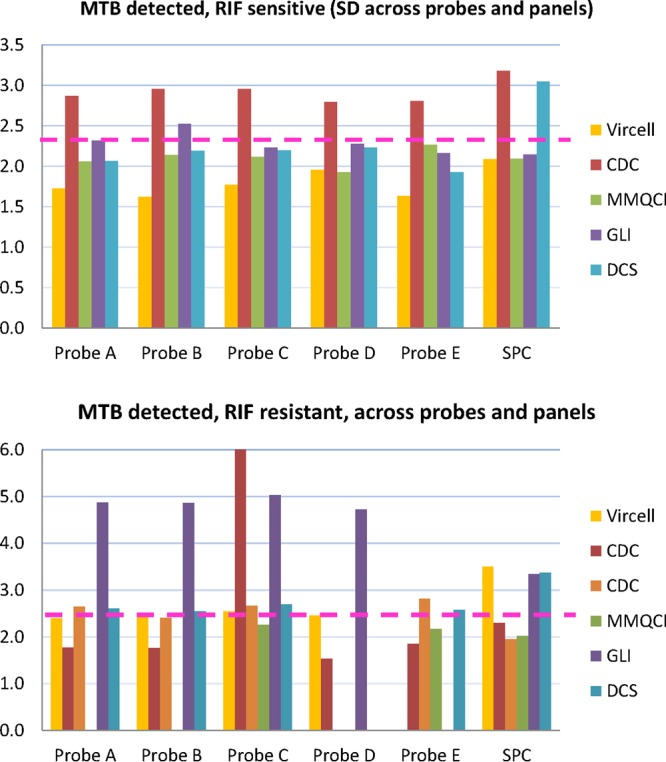
Bar charts of SD for each probe and internal control (SPC) across all panels for two groups of samples. (Top) M. tuberculosis detected, RIF susceptible; (bottom) M. tuberculosis detected, RIF resistant. The dotted line separates the SD values into two groups (>2.3 and <2.3).