
FIG 6.
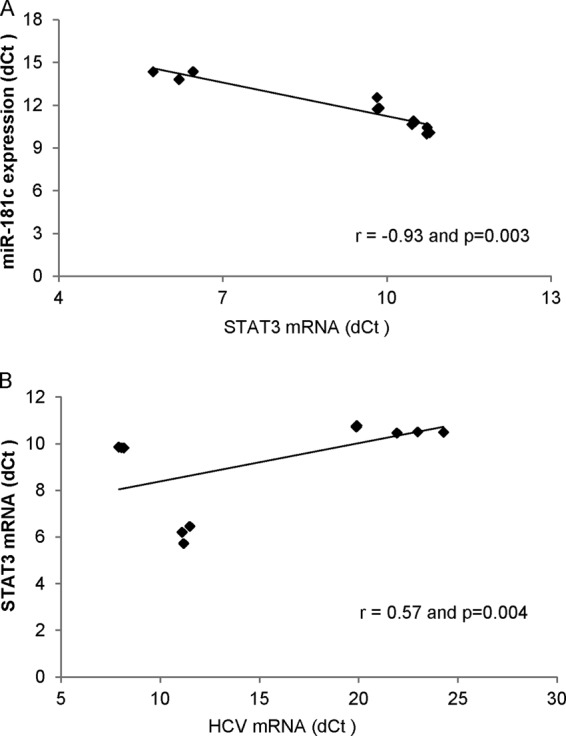
Correlation of STAT3, HCV RNA, and miR-181c expression levels in liver biopsy specimens. Correlation plots are shown for miR-181c versus STAT3 levels (A) and STAT3 versus HCV RNA levels (B). Statistical analysis was done by using the Spearman correlation.