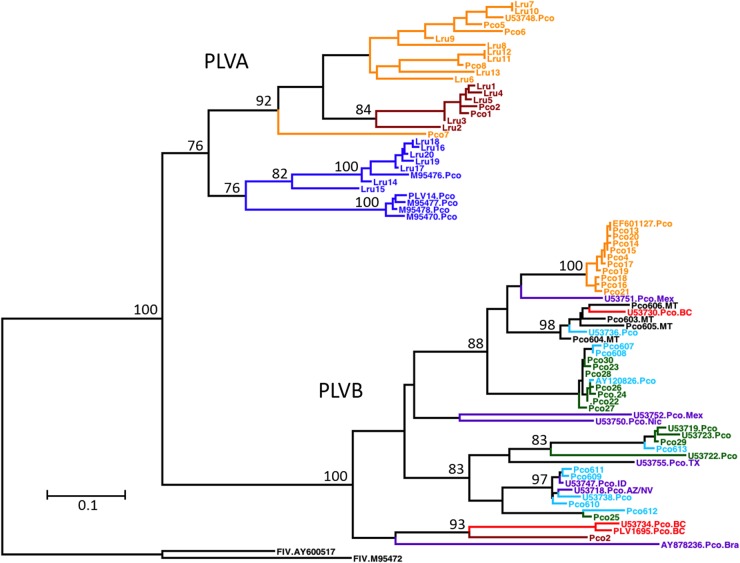
FIG 3.
PLVA and PLVB exhibit distinct evolutionary histories and different contemporary phylogeographic distributions. This is a maximum likelihood phylogenetic tree constructed from a 471-bp region of pol illustrating the relationship among the isolates analyzed in this study and previously reported PLV sequences (n = 80 isolates; 48 PLVB and 32 PLVA isolates). Bootstrap values (100 replicates) with >70% support are indicated on nodes. Branch lengths represent the numbers of substitutions per site (see the scale bar). Two domestic cat FIV sequences (chosen to provide continuity with data reported previously by Franklin et al. [8]) were included as an outgroup. Isolate names and colors are the same as those described in the legend of Fig. 2 (see also Fig. SA2 in the supplemental material). Sequences from geographic regions outside our study areas are depicted in purple and are labeled with the GenBank accession number and sample location (BC, British Columbia; AZ/NV, Arizona/Nevada; ID, Idaho; Mex, Mexico; Nic, Nicaragua; Bra, Brazil; TX, Texas).

