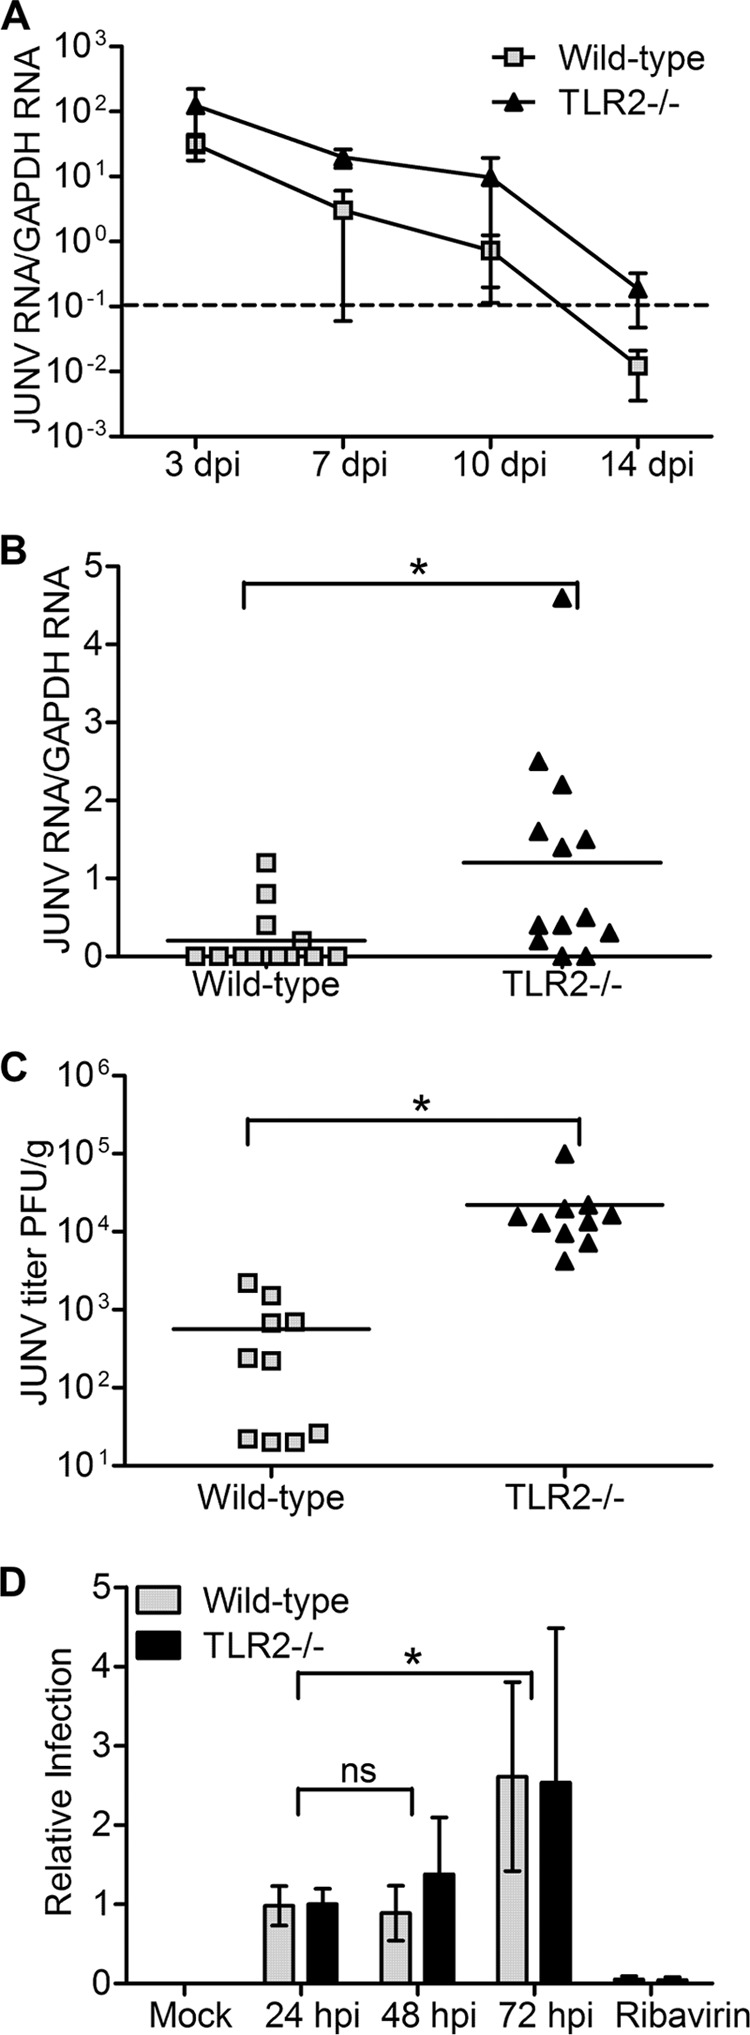
FIG 4.

TLR2−/− mice are more highly infected with JUNV C1 than are wild-type mice. (A) Time course of infection. Spleens were harvested on the indicated days postinfection, and viral RNA was quantified by RT-qPCR. Five mice of the corresponding phenotypes were used for each time point. Kaplan-Meier analysis showed that there was statistical significance (P < 0.05) between WT and TLR2−/− mouse RNA level curves. The dashed line indicates the limit of detection for this RT-qPCR assay. (B and C) Additional mice were infected with JUNV C1, and at 7 days postinfection, viral RNA was quantified by RT-qPCR (B), and viral titers were determined (C). Each point represents an individual mouse. (D) WT (NR-9456) and TLR2−/− (NR-9457) mouse macrophage cells were infected with JUNV C1 at an MOI of 0.1 and harvested at 24, 48, and 72 hpi, and viral RNA was measured by RT-qPCR. As a control, infected cells were treated with ribavirin, and the viral RNA level was quantified at 48 hpi. Two-tailed Student's t test was used to determine significance. *, P < 0.05; ns, no statistical significance.
