
FIG 8.
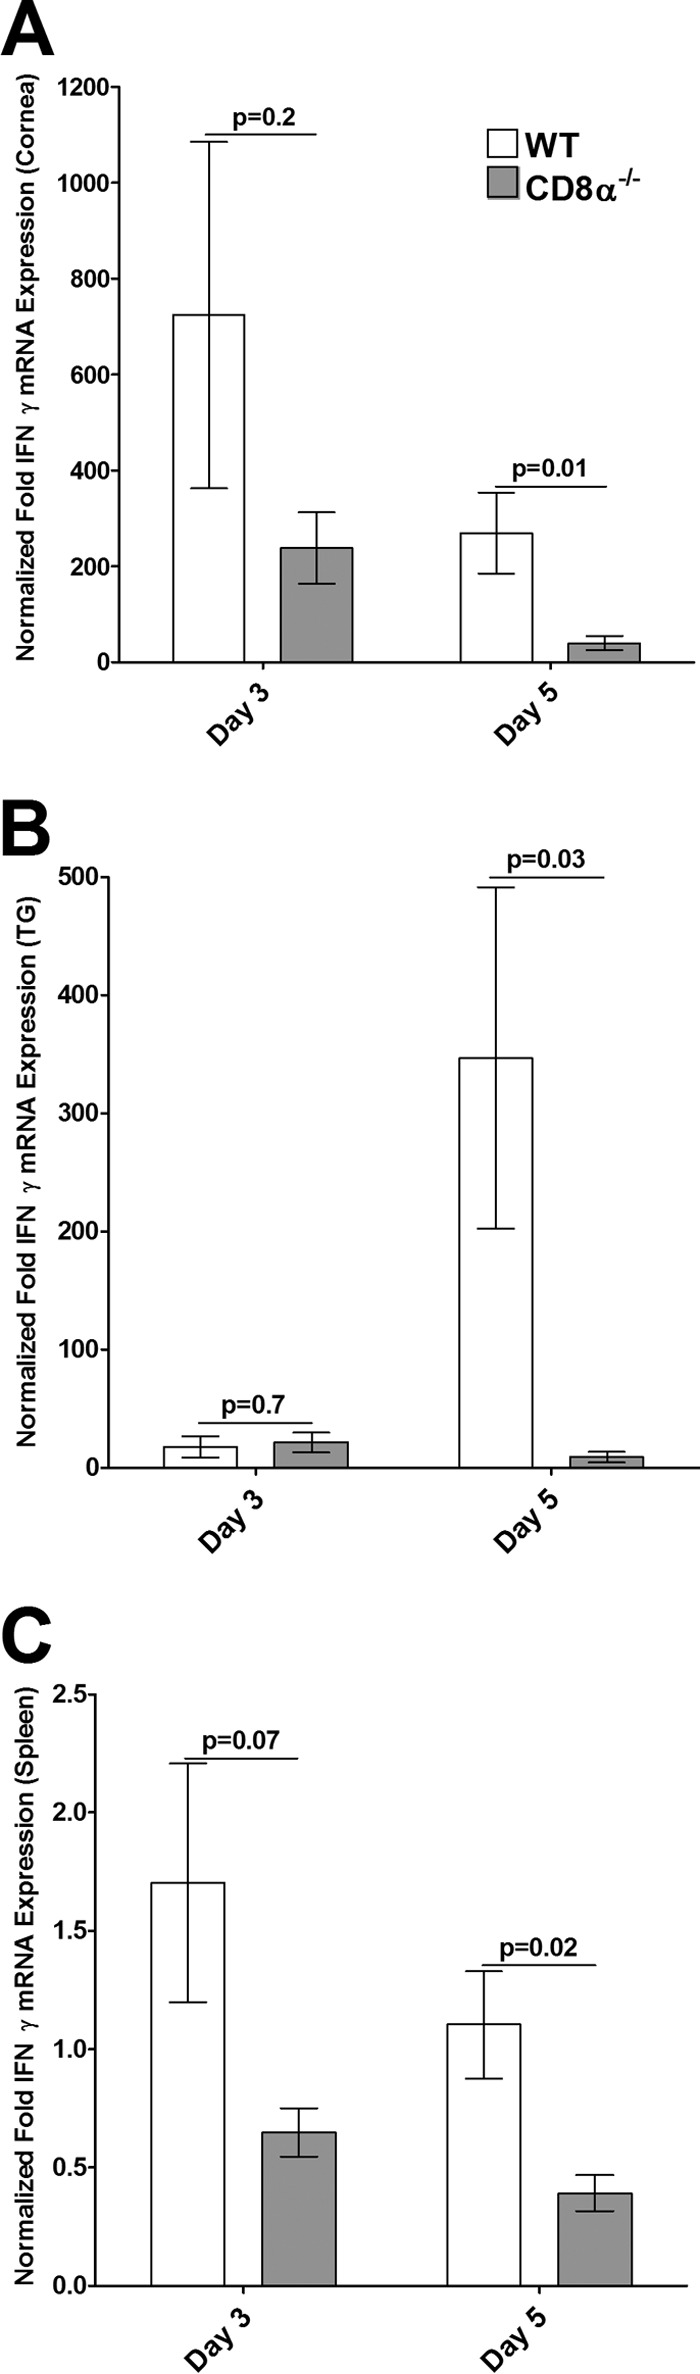
Expression of IFN-γ in corneas (A), TG (B), and spleens (C) of infected mice. Total RNA isolated from individual mouse corneas and TG as described in the legend to Fig. 5 as well as RNA from the spleens of the same mice was used to estimate the relative expressions of IFN-γ transcripts in WT and CD8α−/− immunized mice. IFN-γ expression in the cornea, TG, and spleen was determined on days 3 and 5 p.i. GAPDH expression was used to normalize the relative expression of each transcript in the cornea, TG, or spleen in each group. Each bar represents the mean ± SEM from 6 corneas or TG and 3 spleens.