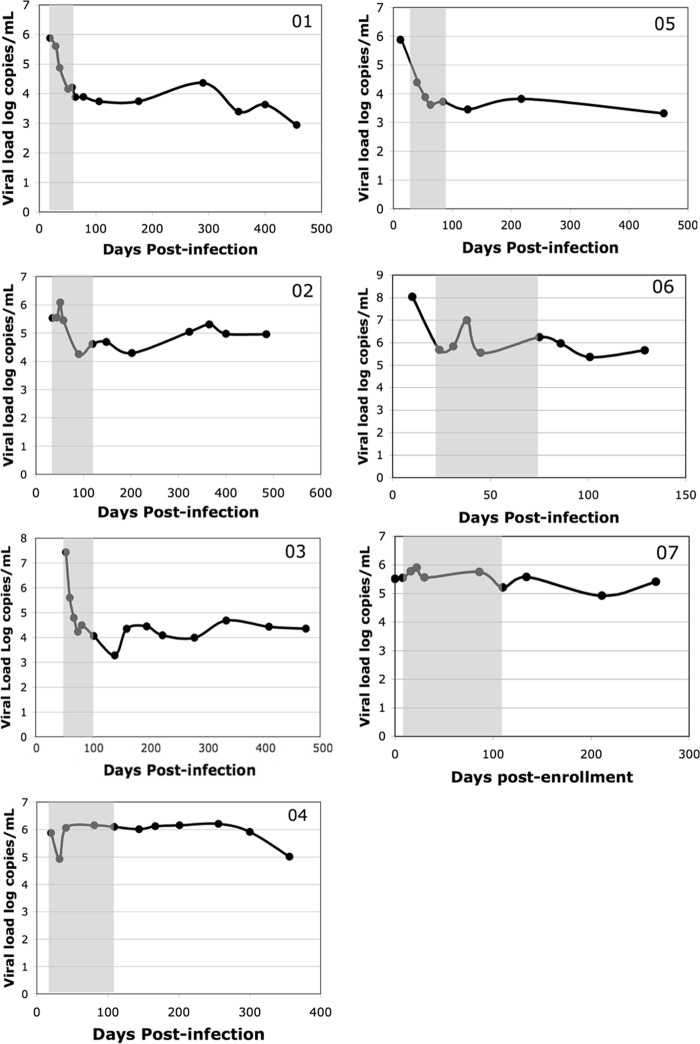
FIG 1.
Decrease in the level of viremia after acute infection. Each panel shows the viral load (log copies of virus per milliliter of plasma) versus time in days postinfection. Subject identifiers are given in the upper right corners. The day of infection was assumed to be 7 to 10 days prior to the onset of symptoms of subjects presenting with acute retroviral syndrome or the day of the known exposure if reported by the subject. Note that subject 07 was in the early chronic phase of infection (positive by Western blotting at enrollment); therefore, for this subject, time is expressed as days postenrollment, not days postinfection. Each point corresponds to a study visit during which plasma and PBMCs were banked and clinical data were collected. The shaded area indicates the time points selected for study.

