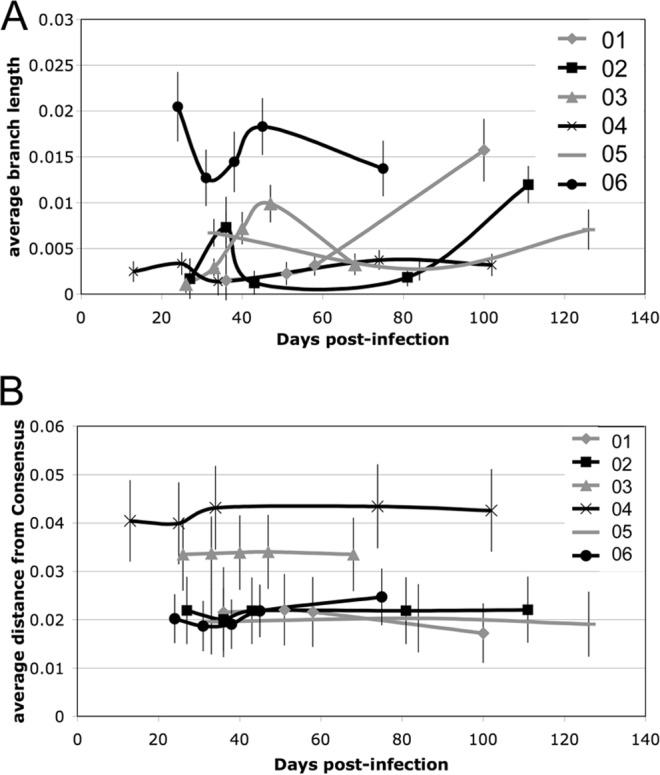
FIG 3.

Sequence diversity and divergence from consensus over time after acute infection. (A) The amount of diversity, expressed as the average branch length for all sequences isolated at each time point, is plotted relative to the number of days postinfection. (B) The average divergence from the clade B consensus for all sequences at each time point is plotted relative to the number of days postinfection. Both diversity and divergence estimates were evaluated with 500 bootstrap replicates to give standard errors of the means (indicated by error bars).
