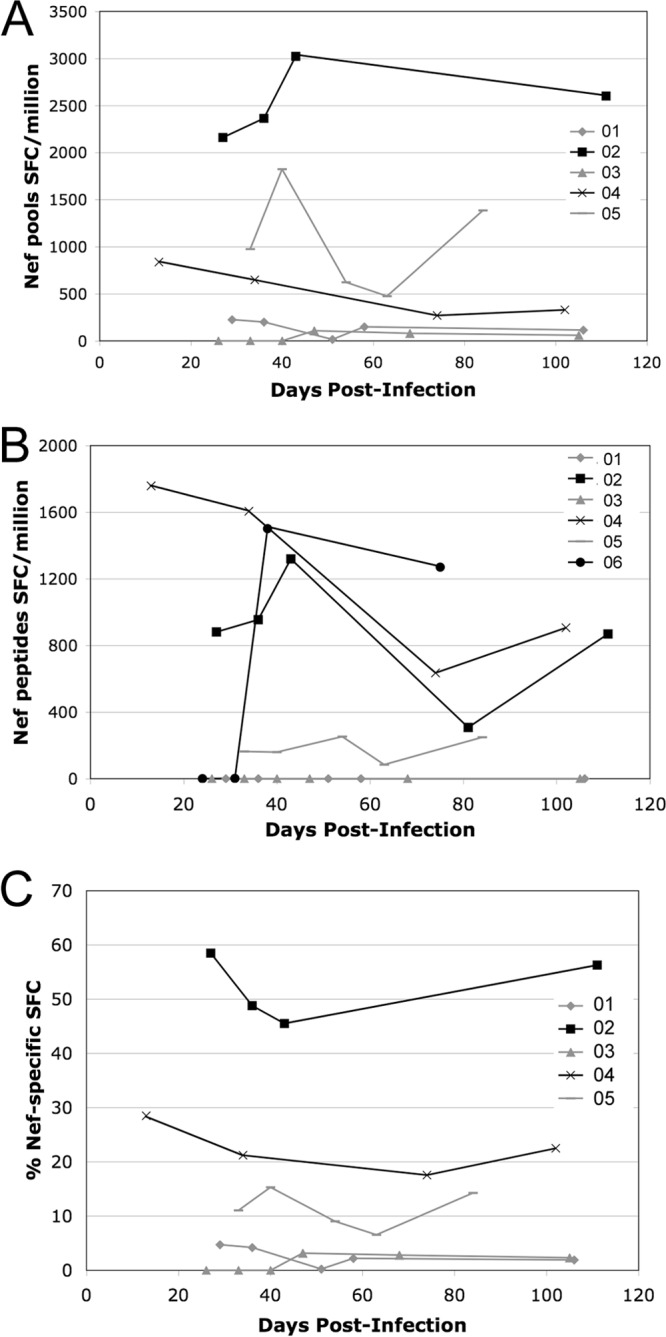
FIG 4.

Nef-specific CTL responses over time after acute infection. Nef-specific CTL responses were measured by IFN-γ ELISpot assays using polyclonally expanded CD8+ cells from each study visit. (A and B) Cells were tested either with a library of overlapping 15-mers corresponding to the clade B consensus Nef sequence in pools of 12 to 16 peptides each (A) or with individual peptides representing HLA-matched reported minimal epitopes corresponding to each subject's HLA type (B). Responses are reported as the number of spot-forming cells (SFC) per million CD8+ cells and are plotted over time, expressed as days postinfection. Due to limited cell numbers, subject 06 was tested only with the HLA-matched minimal-epitope peptides and not with the Consensus B peptide pools. (C) The percentage of total SFCs attributable to Nef-specific responses is plotted for subjects tested with the full library of 15-mer pools.
