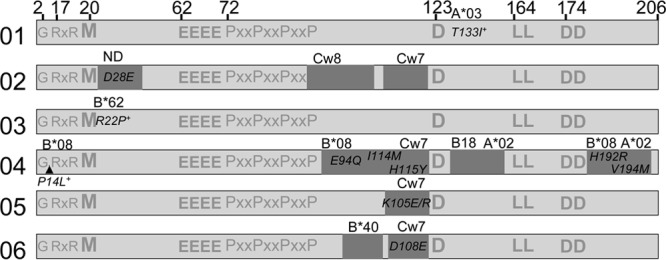
FIG 5.

Map of Nef-specific CTL responses and associated amino acid changes relative to important functional sites. For each acutely infected subject, a line diagram of Nef shows the sites targeted by CTLs (dark shading) relative to known residues and domains important for Nef function. CTL responses were mapped by IFN-γ ELISpot assays using HLA-matched minimal-epitope peptides as shown in Fig. 4B. The amino acid positions of important functional sites are listed at the top. See Results for details of the functions associated with these positions. Within the shaded boxes indicating targeted epitopes are corresponding fixed amino acid substitutions or polymorphisms that appeared between the first and last study visits. Additional amino acid sites under positive selective pressure but not detected by ELISpot assays are indicated by plus signs. The HLA restriction of the epitope is indicated above each shaded box.
