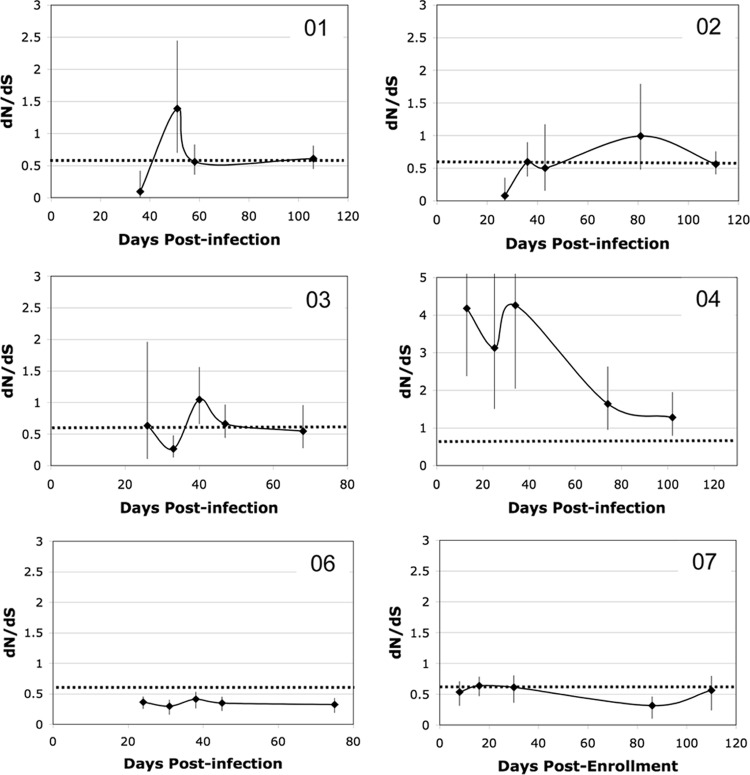
FIG 6.
Change in selective pressure on Nef over time after acute infection. The amount of adaptive evolution was measured by calculating a maximum likelihood estimate of the dN/dS ratio with the 95% CI for all sequences at each time point. Values are plotted against time, expressed as days postinfection (or as days postenrollment for chronically infected subject 07). Data for all subjects are shown on the same scale except for subject 04, who had much higher dN/dS values than the others. The dotted lines mark a baseline dN/dS ratio of 0.6, the average value reported for Nef from chronically infected subjects. The sequence data obtained for subject 05 were not adequate for determination of the pattern of adaptive evolution in this individual, but at the viral set point, the dN/dS ratio had stabilized near baseline at 0.53.

