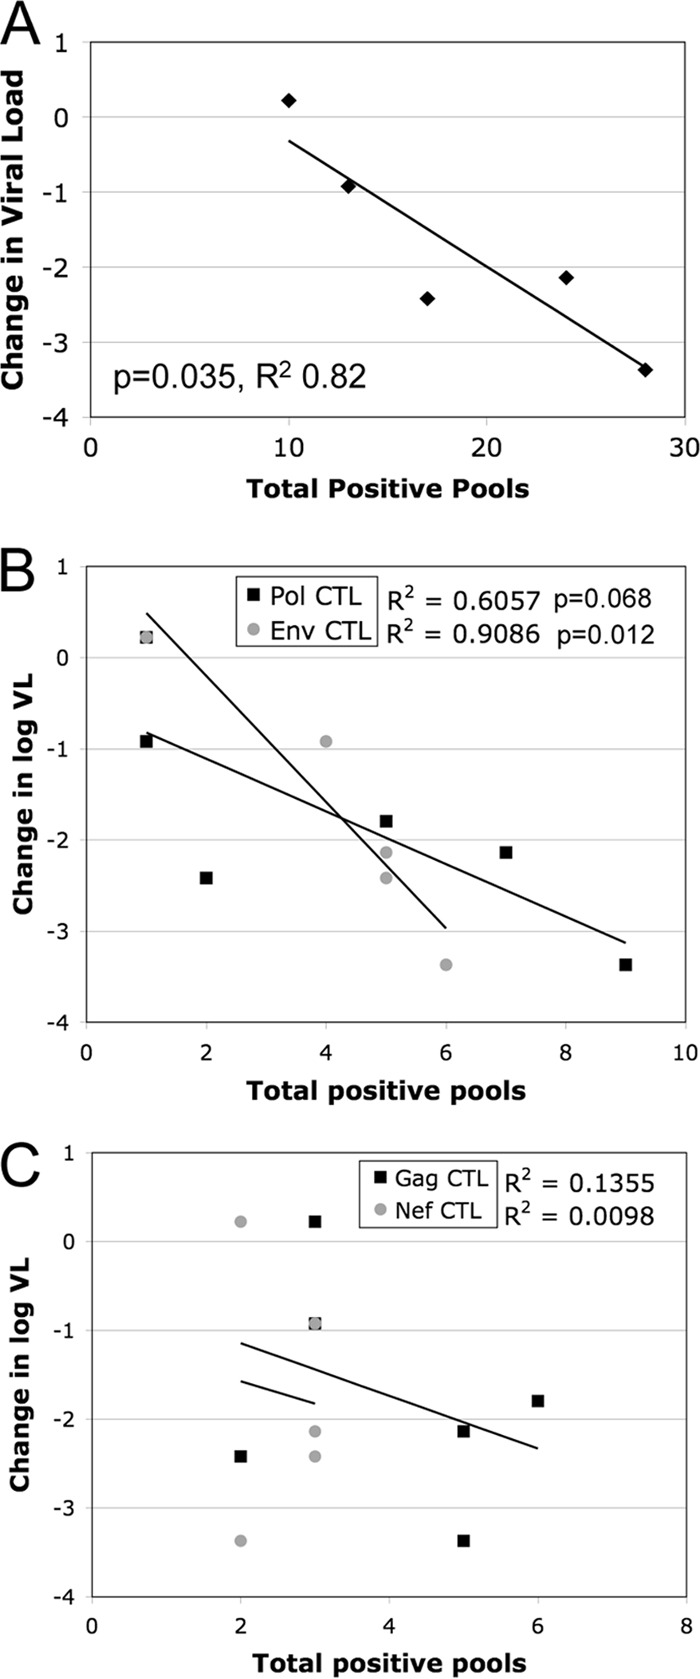
FIG 9.

Correlations between CTL responses and viremia levels after acute infection. (A) Using regression analysis, a statistically significant inverse relationship was observed between the change in the log viral load (VL) between peak and set point viremia and the total number of IFN-γ ELISpot assay-positive peptide pools. (B and C) Analysis of the relationship between the magnitude of protein-specific responses and the decline in viremia revealed significant inverse relationships with Env- and Pol-specific subsets (P, 0.012 and 0.068, respectively) (B) but no relationship with Nef- and Gag-specific responses (P, 0.87 and 0.47, respectively) (C). For each correlation, significant P values and R2 are shown.
