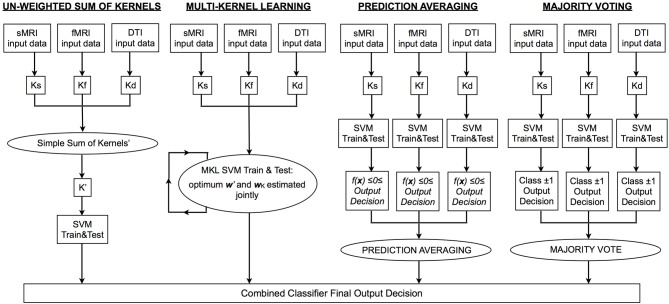
Figure 1.
Flowchart depicting the processing pipeline for each type of integrative approach. MRI, magnetic resonance imaging; sMRI, structural MRI; DTI, diffusion tensor imaging; fMRI, functional MRI; Ks/f/d, kernel matrix for sMRI/fMRI/DTI data; SVM, support vector machine; K′, integrated kernel matrix; f(x), SVM decision function; w′, optimum vector of predictive weights obtained using K′; wK, optimum weight coefficient assigned to each base kernel.

