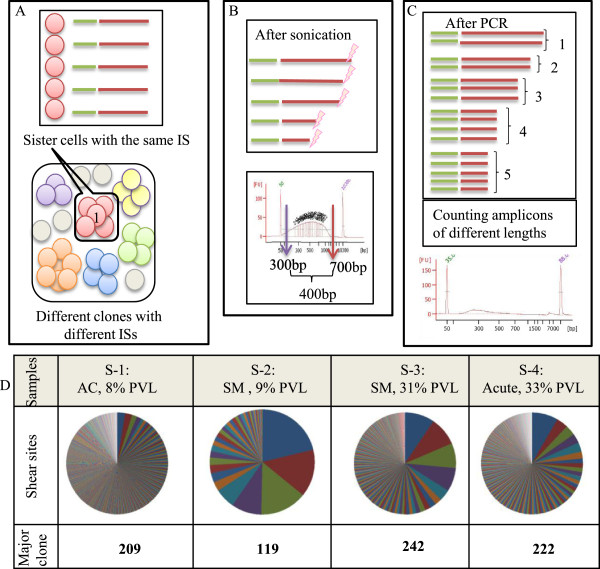
Figure 1.

Estimating clone size by ‘shear sites’. Also see Additional file 2: Figure S2 for a simple image from an integration site and its shear sites. (A) Depicted is the complex population of uninfected cells (grey circles) together with infected clones (circles of different colors). A clone is shown as a group of sister cells (circles of the same color) having the same integration site (IS). Different clones are distinguishable based on differing integration sites, and thus the number of integration sites represents the number of infected clones. For example, the six different unique integration sites refer to six unique clones. (B) Genomic DNA fragmented by sonication generates random shear sites (fragments of different length). Fragment size, measured by an Agilent Bioanalyzer, ranged from 300 to 700 bp. This size range can theoretically provide approximately 400 variations. (C) The size distribution of fragments decreased following amplification by integration-site-specific PCR. From the deep sequencing data, the original number of starting fragments could be estimated by removing PCR duplicates and counting fragments with different lengths. For example, five different lengths of PCR amplicons represent five infected sister cells. (D) We analyzed four samples, including (S-1: asymptomatic carrier (AC), (8% PVL)), (S-2: smoldering (SM), (9% PVL)), (S-3: smoldering, (31% PVL)), and (S-4: acute, (33% PVL)). Using our method, the clone sizes were quantified by considering only shear sites. The first major clone (the largest clone) of each sample was mapped to (chr 11-41829319 (+)), (chr 15: 59364370 (+)), (chr 4-563543 (-)), and (chr X - 83705328 (-)), respectively. The shear site variations of each major clone were 209, 119, 242, and 222, respectively. Different colors on the pie graphs indicate different integration sites, and the size of each piece represents the clone size.
