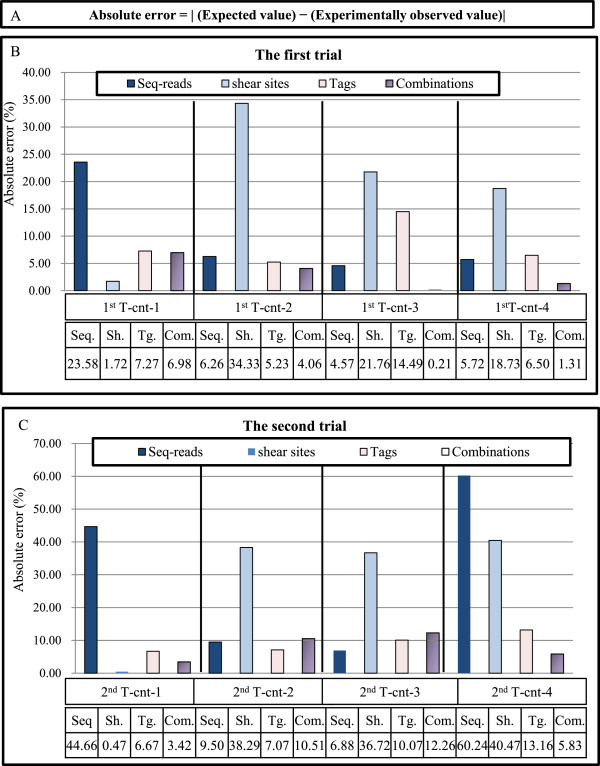
Figure 5.

Evaluating the accuracy of the clonality analysis. (A) Absolute error is calculated by subtracting the expected values from the experimentally observed values. (B, C) The accuracy of the method is evaluated by calculating the absolute error of the clone size estimation of the control samples (see Figure 3). The y axis represents the percentage of absolute errors in different conditions including: (1) raw sequencing reads without removing duplicated PCR, (2) only shear sites, (3) only tags, and (4) the combination of tags and shear sites. The absolute errors of the final optimal condition: the first trial: (Bowtie parameters: -v 3 - - best, and filtering condition: (merging approach) JT-10), and the second trial: (Bowtie parameters: -v 3 - - best, and filtering condition: (merging approach) JT-10-1%) are presented in this figure. Please refer to Additional file 1: Figure S6 for the absolute errors in all examined conditions. (B) The absolute errors of the first trial. (C) The absolute errors of the second trial. See Additional file 1: Figure S4 for information on merging approach.
