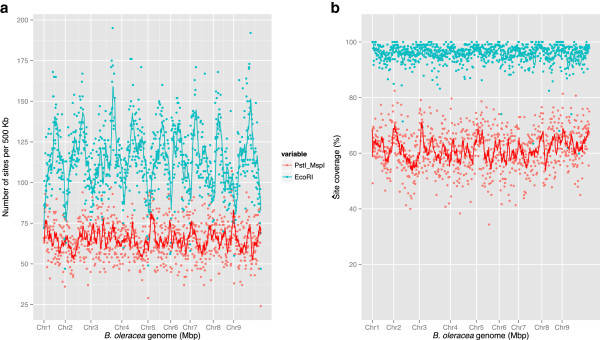
Figure 1.

Comparison of efficacy of GBS methods. (a) Distribution of restriction sites across the B. oleracea genome, representing potential tag sites for RAD (blue) and GBS (red). (b) Observed tag coverage for restriction sites within the B. oleracea genome for RAD (blue) and GBS (red). A sliding window of 500 kb was used and the trend line is based on the mean of 10 windows.
