
Figure 7.
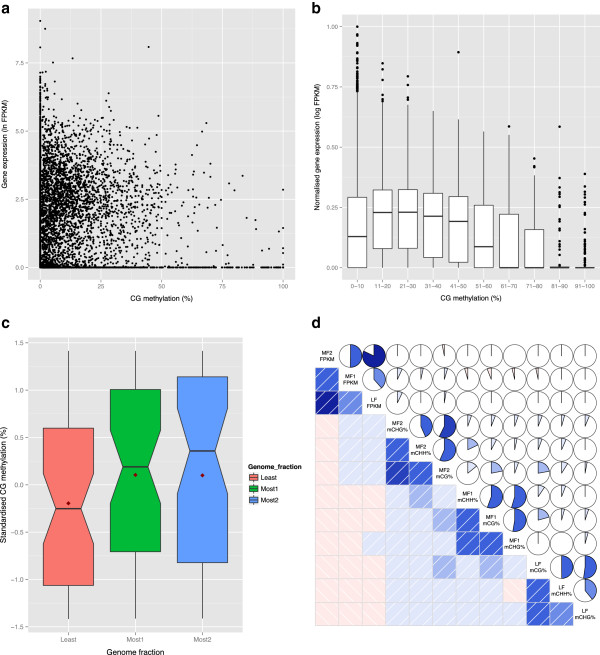
Correlation of methylation status with gene expression and genome triplication in B. oleracea. (a) Expression levels (log(FPKM)) plotted against mCG gene body methylation levels. (b) Box plot representation of different levels of mCG gene body methylation in syntenic genes (along x-axis) with normalized gene expression levels plotted on the y-axis. (c) Box plot representation of different levels of mCG observed across the three sub-genomes. (d) Correlation of gene expression (FPKM) and methylation levels among the fully retained orthologues of the three genomes. Below the diagonal, positive and negative pair-wise correlations are indicated in blue and red, respectively. Darker coloring indicates a greater magnitude for the correlation. Above the diagonal, the color and extent of the filled area of each of the pie-charts represents the strength of each pair-wise correlation. Positive and negative correlations are indicated by the pie being filled in a clockwise or anticlockwise direction, respectively.