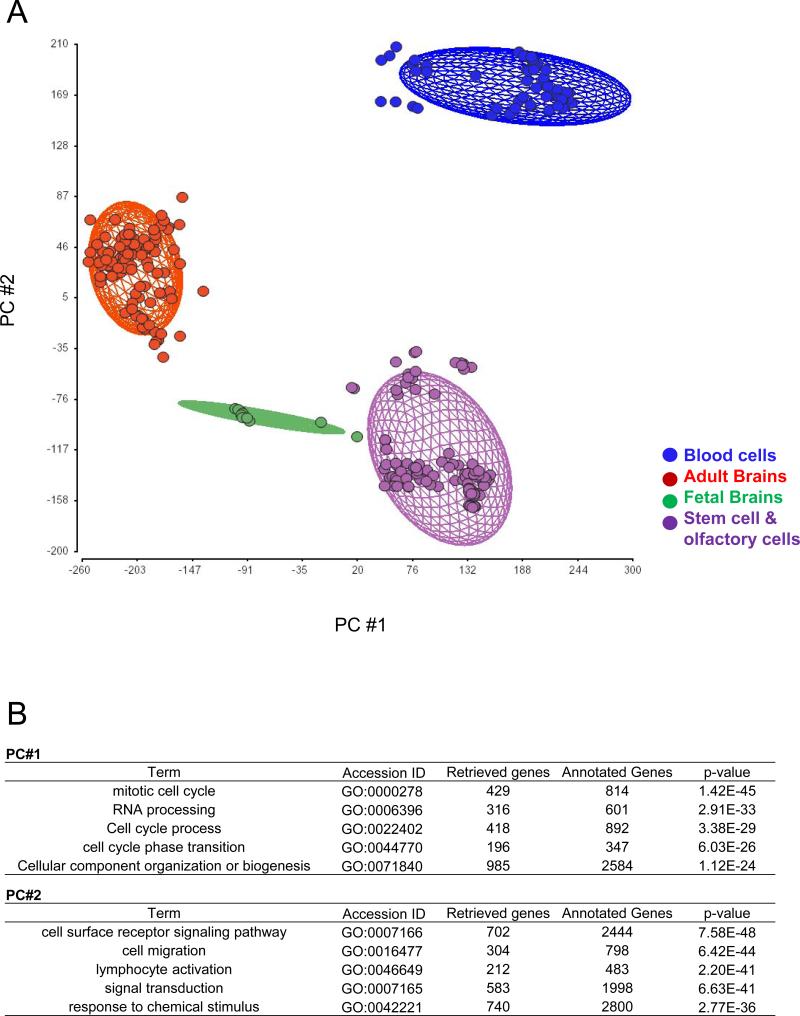
Fig. 1.
A) Sample distribution among various tissues obtained by principal component analysis (PCA) in Partek Genomics Suite using a data set of gene expression from 279 experiments. The ellipsoids represent two standard deviations beyond the mean of the centroid of each tissue group. Data points correspond to samples (red, adult brains; green, fetal brains; blue, blood cells; purple, stem cells and olfactory cells). B) Representative biological processes that contribute to the distribution of PC#1 and PC#2 (p <1.0E-25) through gene ontology assessment are depicted.

