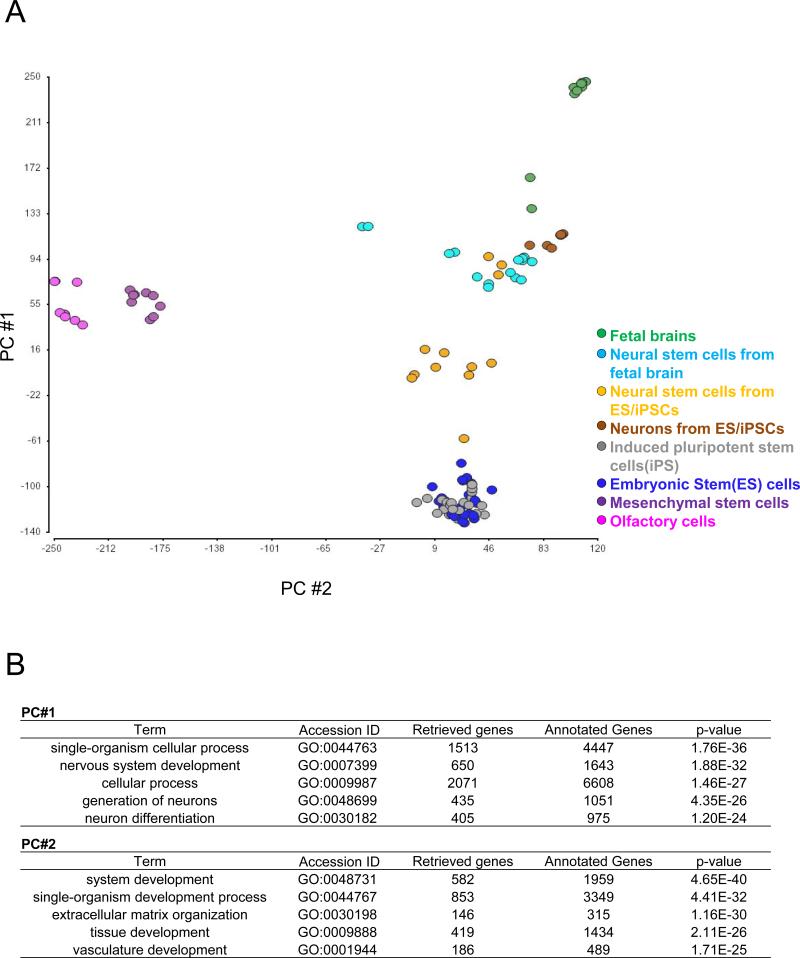
Fig. 2.
A) Results of principal component analysis (PCA) from stem cell group samples. Data points correspond to samples (green, fetal brains; light blue, neural stem cells from fetal brains; orange, neural stem cells from embryonic and induced pluripotent stem cells; blue, embryonic stem cells; gray, induced pluripotent stem cells; purple, mesenchymal stem cells; and pink, olfactory cells).
B) Representative biological processes that contribute to the distribution of PC#1 and PC#2 (p <1.0E-20) through gene ontology assessment are depicted.

