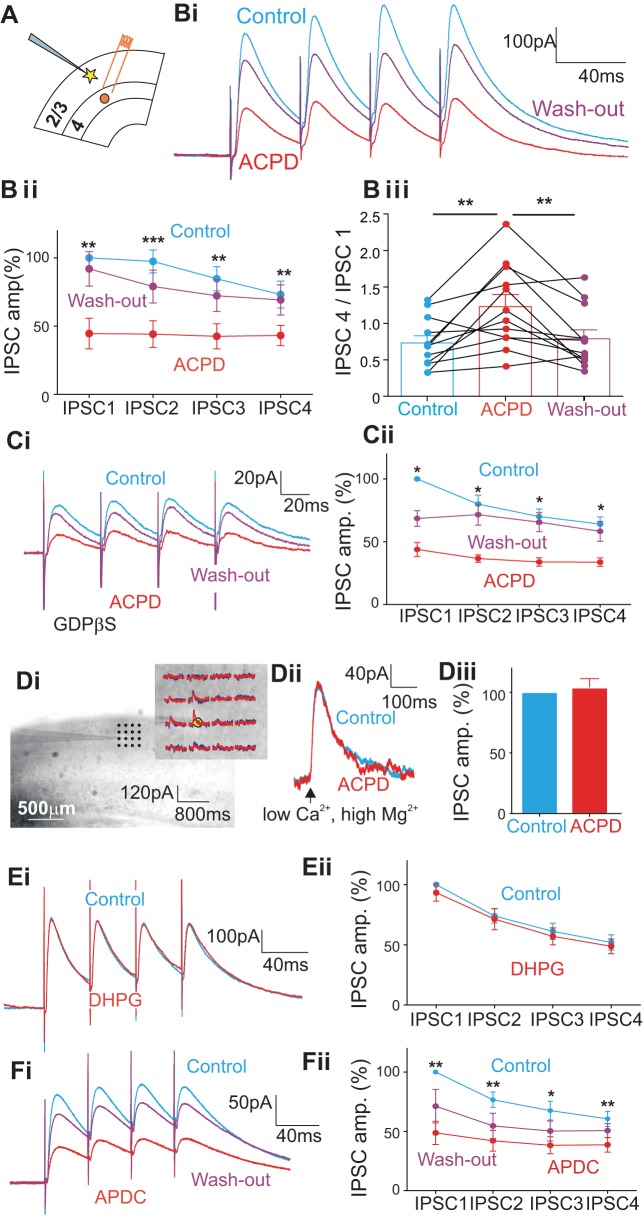
Fig. 1.
Effects of the metabotropic glutamate receptor (mGluR) agonist ACPD on the inhibitory inputs from subjacent layer 4 to cells in layers 2/3 in V1. Asterisks indicate significance of comparisons: *P < 0.05, **P < 0.01, and ***P < 0.001. A: cartoon showing the placement of a bipolar concentric electrode in layer 4 in V1 (red circle) and the recorded cell in layers 2/3 (yellow star). B: effects of ACPD on inhibitory postsynaptic currents (IPSCs) evoked by 4 pulses delivered at 25 Hz. Bi: traces showing an example experiment. Bii: graph showing the normalized amplitudes (IPSC amp) of the 4 IPSCs before (Control) and after ACPD application (ACPD) as well as those after the recovery by washing out (Wash-out). Each of the 4 IPSCs was decreased significantly by ACPD application and was partly recovered after washing out. Biii: graph showing the effects of ACPD on the ratio of the 4th IPSC to the 1st IPSC of each recorded cell and that the washing out reversed the effect on most of the cells. C: effects of ACPD and washing out on the evoked IPSCs while blocking the postsynaptic G protein-coupled pathway with GDPβS in the intracellular solution. Ci: traces showing an example experiment. Cii: graph showing the normalized amplitudes of 4 IPSCs before (Control) and after the ACPD application (ACPD) and those after washing out (Wash-out). D: effect of ACPD on direct application of GABA to recorded cells achieved by GABA photostimulation in a low-Ca2+, high-Mg2+ ACSF. Di: recording setup and example of direct GABA responses. The photomicrograph shows the recording electrode, and the yellow star shows the location of the recorded cell, with examples of outward currents evoked. Dii: evoked outward currents before (blue) and after the ACPD application (red) evoked by GABA photostimulation; the arrow shows the time of photostimulation, 100 ms after the recording starts. Diii: no significant change of ACPD was seen on outward currents. E and F: effects of the specific mGluR agonists. E: the group I mGluR agonist, DHPG, produced no significant change in evoked IPSCs. F: the group II mGluR agonist, APDC, produced a significant decrease in evoked IPSCs, and the effect could be partly reversed by washing out.

