
Fig. 6.
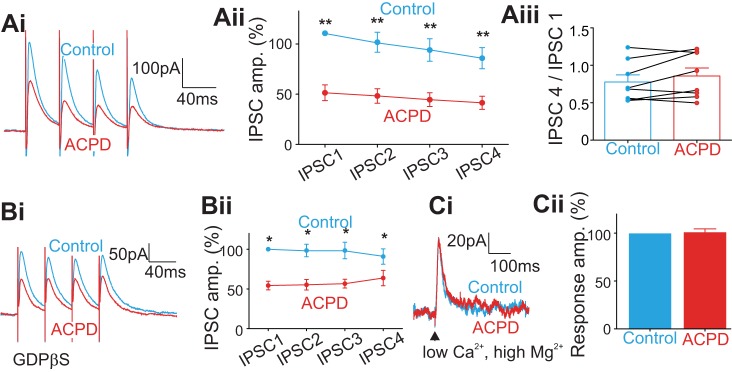
Effects of ACPD on the inhibitory inputs from adjacent layer 4 to cells in layer 4 in A1; meaning of asterisks as in Fig. 1. A: the general effect of ACPD. Ai: traces showing the evoked IPSCs before and after ACPD application. Aii: graph showing the normalized amplitudes of the 4 IPSCs before and after ACPD application. Each of the 4 IPSCs was decreased significantly by ACPD application. Aiii: graph showing the effects of ACPD on the ratio of the 4th IPSC to the 1st IPSC for each recorded cell. B: effects of ACPD on the evoked IPSCs while blocking the postsynaptic G protein-coupled pathway with GDPβS in the intracellular solution. C: effect of ACPD on direct application of GABA to recorded cells achieved by photostimulation of GABA in a low-Ca2+, high-Mg2+ ACSF.