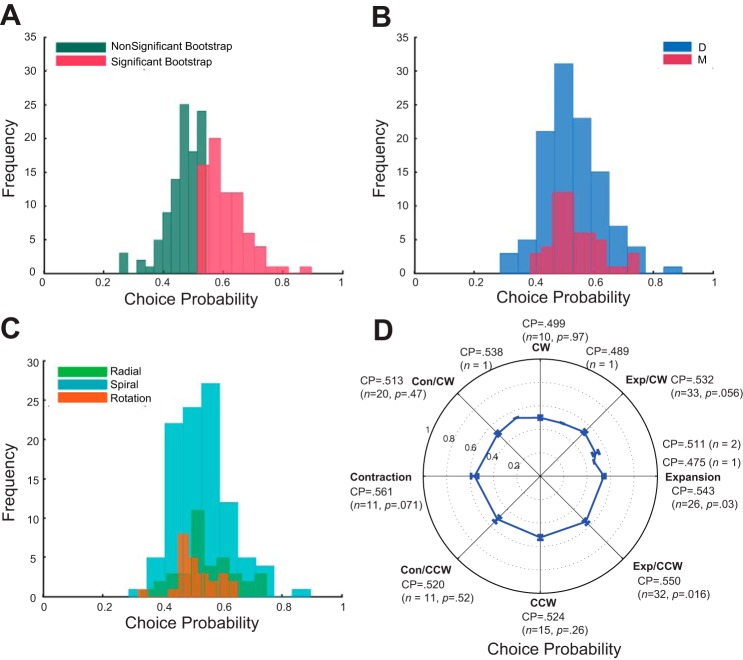
Fig. 5.
Trial-to-trial correlation between neural and behavioral performance: choice probability (CP) analysis. A: the distribution of all MSTd neurons (n = 163). The average CP is 0.532, which is significantly different from chance (t = 4.5, P = 0.00001). The green bars represent the CPs of nonsignificant bootstraps (M = 0.463, n = 90, P < 0.0001), and the red bars the CPs of significant bootstraps (M = 0.609, n = 73, P < 0.0001). There is a relatively large CP (0.893) in the data, and this may indicate an outlier. Without this outlier, the average CP becomes 0.53, still significantly different from chance (t = 4.38, P = 0.00002). B: the average CP for animal D is 0.531, and for animal M it is 0.535. Both of them are significantly different from chance (t = 3.38, P < 0.0001; t = 3.11, P = 0.0031, respectively). C: the average CP for radial, spiral, and rotation cells. The average CP for radial cells is 0.548 (P = 0.0044), spiral cells 0.531 (P = 0.0013), and rotation cells 0.514 (P = 0.33). D: the average CP, number of cells, and its P value from t-test are presented for each subpopulation of MSTd neurons. Note that the vector analysis method classified only a small number (n = 11) of the neurons as Con tuned. CPs of cells in this subpopulation (Con cells) vary substantially, and the large variation and small number of cells causes its statistical test to be not significant from chance (M = 0.561, P = 0.071).

