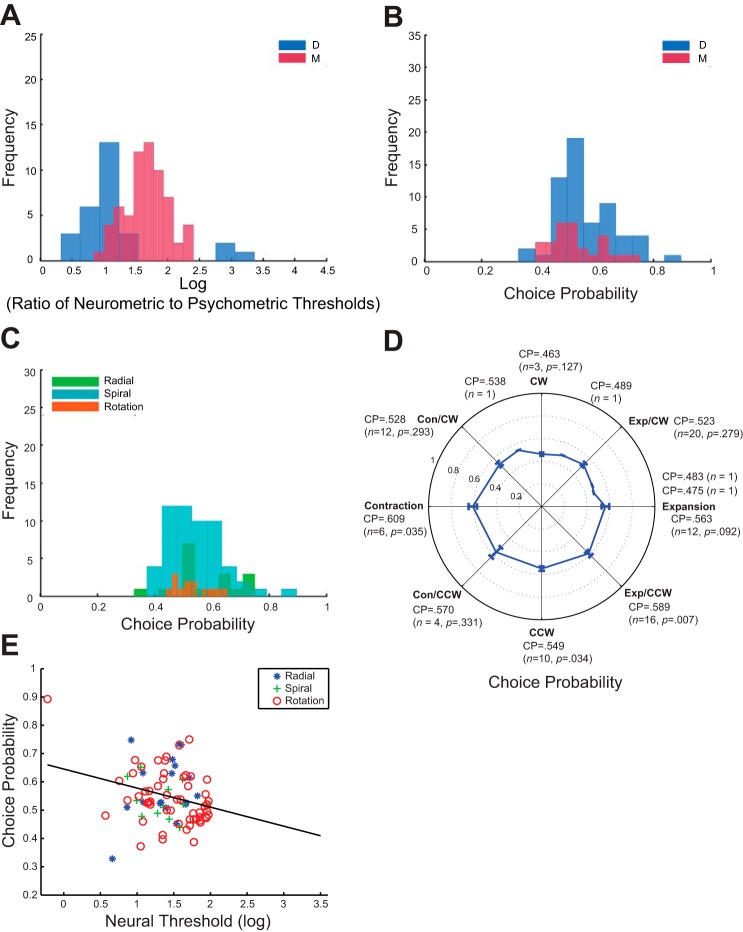
Fig. 7.
Analysis on the most sensitive neurons. A: the distribution of ratio of neurometric to psychometric thresholds on logarithmic scale. The average log ratio is 1.523 (n = 87), and it is significantly larger (P < 0.0001, independent t-test) for monkey D (1.669) than for monkey M (1.189). B: the average CP for animal D is 0.560 (P < 0.0001, one-sample t-test, same in the following) and for animal M it is 0.526 (P = 0.141). C: the average CP for radial, spiral, and rotation cells. The average CP for radial cells is 0.578 (P = 0.0076), spiral cells 0.529 (P = 0.139), and rotation cells 0.544 (P = 0.0015). D: the average CP, number of cells, and its P value from t-test are presented for each MSTd neuron subpopulation. E: the correlation between the CP and neurometric threshold is r = −0.272 (P = 0.011). The black line is the linear regression fitted line. The three subpopulations are: blue asterisk, radial motion selective neurons (Exp cells in majority); green cross, spiral motion selective neurons; red circle, rotation motion selective neurons (CW and CCW). The fitted linear regression line is CP = −0.067 × neurometric threshold + 0.645. Both regression coefficients are significant (P = 0.011 and P < 0.001, respectively).

