
Figure 2.
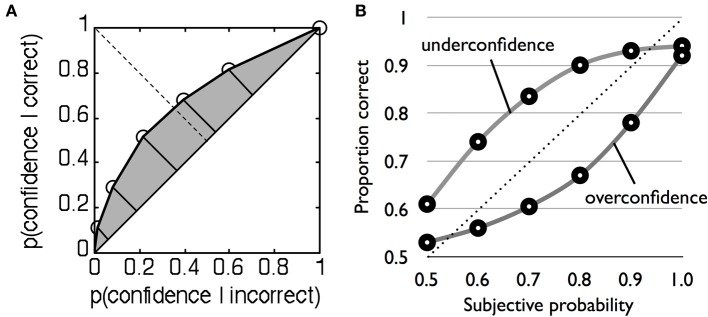
(A) Example type 2 ROC function for a single subject. Each point plots the type 2 false alarm rate on the x-axis against the type 2 hit rate on the y-axis for a given confidence criterion. The shaded area under the curve indexes metacognitive sensitivity. (B) Example underconfident and overconfident probability calibration curves, modified after Harvey (1997).