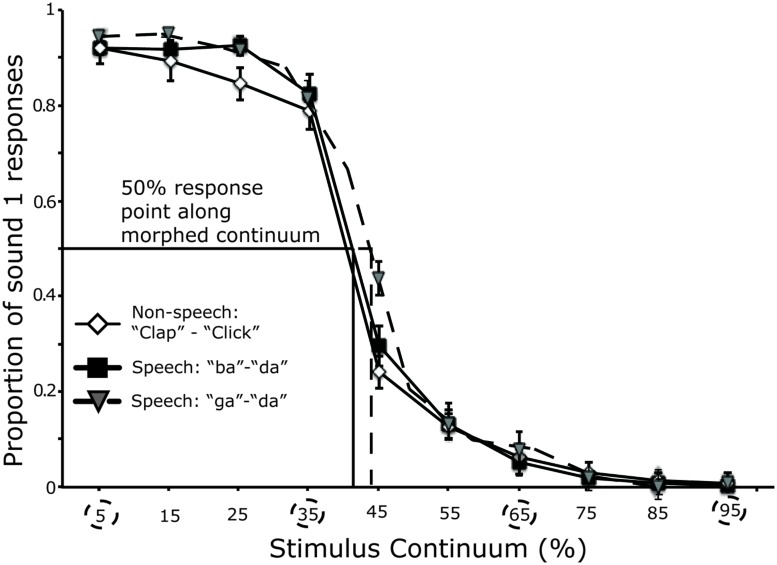
FIGURE 3.
Performance in the identification task (first session) across all participants. A logistic curve was fit to the raw data points across participants. The circles depict the points along the continuum defined as within- or across-category. Lines on the x- axis mark the position of the category boundary for each stimulus pair. Error bars represent the SE of the mean.

