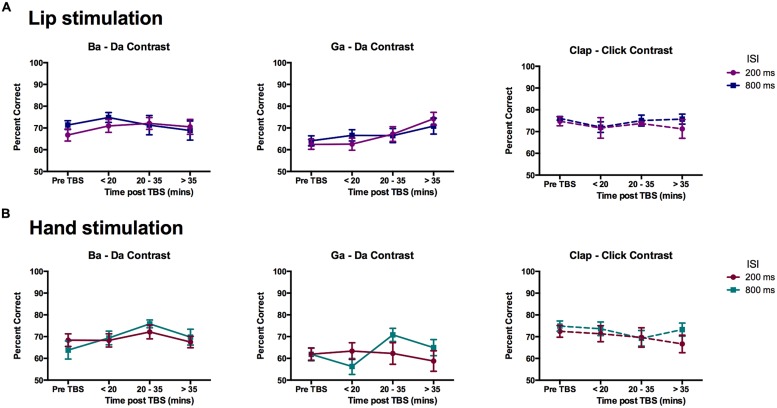
FIGURE 6.
Effects of cTBS on discrimination of within-category pairs. Mean percent correct scores for the participants in the (A) Lip stimulation group (n = 12) and (B) Hand stimulation group (n = 11). A significant improvement in discrimination accuracy for the “ga”–“da” contrast in the group who received cTBS to the lip representation can be seen in the middle graph of the top row. In the hand stimulation group, the performance on the “ga”–“da” contrast was significantly lower than that for the non-speech contrast.

