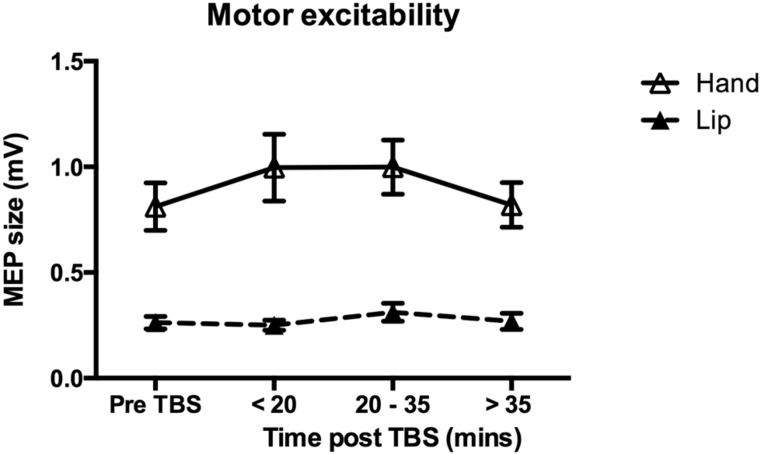
FIGURE 7.
Effect of cTBS on motor excitability. Group mean MEP sizes at each time point (pre-cTBS, early, middle and late post-cTBS) are shown for the target muscle in response to single-pulse TMS over either the Lip (dashed line) or the Hand (solid line) representation in M1. Error bars represent SEs of the mean. There was no significant change in excitability due to cTBS in either the Lip (n = 12) or the Hand (n = 11) group. The difference in amplitudes for the MEPs elicited in the Lip compared to the Hand muscle was expected as this was used in determining the thresholds separately for each muscle (see Section “Materials and Methods” for details).

