
Figure 2.
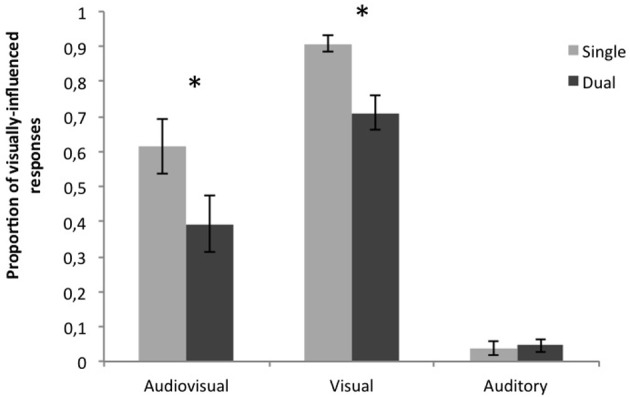
Proportions of visually-influenced responses in the behavioral task for audiovisual, visual and auditory stimuli in Single and Dual task conditions. For audiovisual, and visual stimuli, the proportion of visually-influenced responses (i.e., correct responses to V stimuli and “ni” responses to AV stimuli) was significantly reduced in the Dual task condition. The asterisk denotes significant differences (p < 0.05).