
Figure 3.
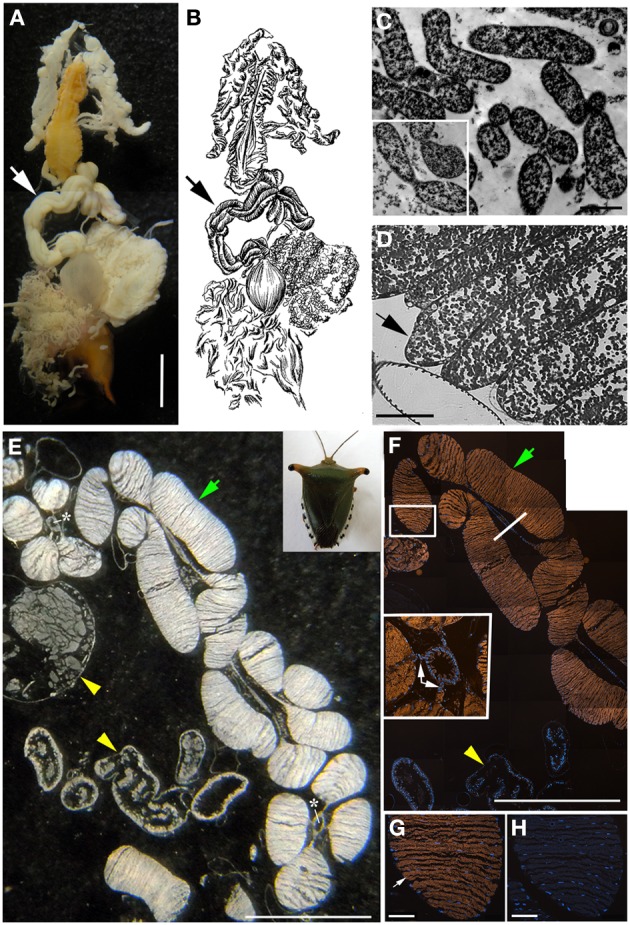
Bacteria associated with Edessa n. sp. 1 (A) Dissected digestive system, arrows indicate symbiont-bearing tissue. Scale, 2 mm (B) Line drawing of the digestive system (C) Transmission electron microscopy of rod-shaped bacteria-like cells within the midgut ceca. Scale, 2 μm. Inset shows bacteria dividing (D) Light microscopy showing bacteria-containing crypts within the midgut ceca (arrow). Scale, 20 μm. (E) A longitudinal section through the midgut ceca. The arrow denotes symbiont-containing midgut crypts, and the arrowheads are provided for reference to the non-symbiont containing tissues, including the upper left sac-like midgut region (M3) and the lower region of the hindgut, as denoted in Futahashi et al. (2013). Asterisks show the main gut cavity. Scale, 2 mm (F) Fluorescence in situ hybridization (FISH) microscopy of the same region as shown in E, hybridized with the Gam42 probe (Manz et al., 1992) labeled with Cy3, shown in orange, and counter-stained with DAPI, shown in blue. The square denotes the region shown in G/H. Scale, 2 mm. The line shows the location of the tissue in the inset in cross section. Inset shows connections between main gut cavity and crypts (arrows). (G) FISH microscopy of the region denoted in F, using the Edessa-symbiont specific probe labeled with Cy3, shown in orange, and counter-stained with DAPI, shown in blue. Scale, 100 μm. (H) FISH microscopy of the region denoted in F, as a negative control using an Epsilonproteobacteria-specific probe (EP404, Macalady et al., 2006), labeled with Cy3, shown in orange, and counter-stained with DAPI, shown in blue. Scale, 100 μm.