
Figure 4.
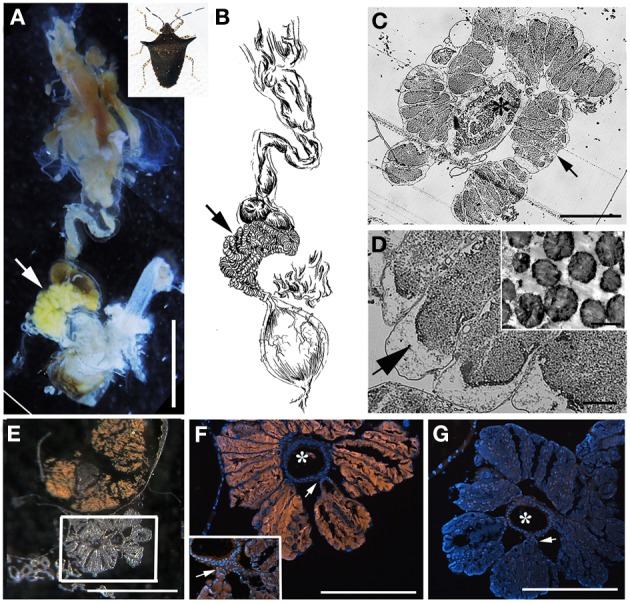
Bacteria associated with Sibaria englemani. (A) Dissected digestive system, arrows indicate symbiont-bearing tissue. Scale, 2 mm (B) Line drawing of the digestive system (C) Light microscopy image of a transverse section showing bacteria-containing crypts within the midgut ceca (arrow). An arrow indicates symbiont-bearing tissue and an asterisk shows the main gut cavity. Scale, 100 μm. (D) Transmission electron microscopy of bacteria-like cells within the midgut ceca. Scale, 20 μm. Symbiont separation from the outer tissue membrane, as denoted by the arrow, may be an artifact of fixation. Inset shows bacteria as irregular cocci (Scale, 2 μm). (E) A transverse section through the midgut ceca. The non-symbiont containing sac-like midgut region (M3), as described in Futahashi et al. (2013), is shown at top. The square denotes the region shown in (F,G). Scale, 2 mm (F) Fluorescence in situ hybridization (FISH) microscopy of the same region as shown in (E), hybridized with the Sibaria-symbiont specific probe labeled with Cy3, shown in orange, and counter-stained with DAPI, shown in blue. An asterisk shows the main gut cavity. Scale, 500 μm. Inset shows connections between main gut cavity and crypts (arrow). (G) FISH microscopy of the region shown in (E,F), as a negative control using an Epsilonproteobacteria-specific probe (EP404, Macalady et al., 2006), labeled with Cy3, shown in orange, and counter-stained with DAPI, shown in blue. Scale, 500 μm.