
Figure 5.
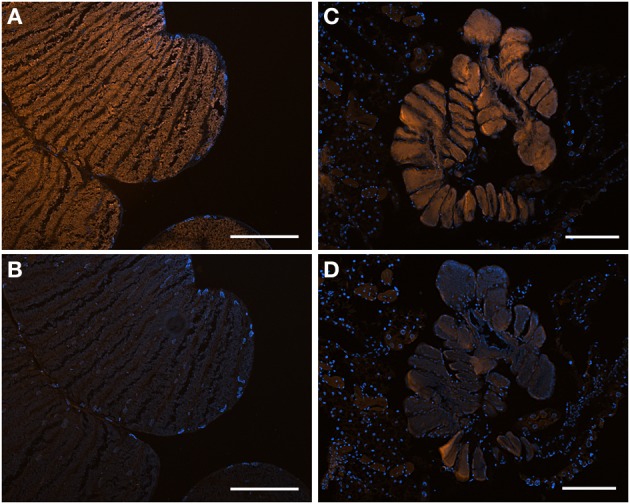
Fluorescent in situ hybridization (FISH) images demonstrating specificity of the newly-designed probes. (A) FISH microscopy of a section through the midgut ceca of Edessa n sp. 1, embedded in, and then removed from, Steedman's wax prior to hybridization, with the Edessa-specific probe labeled with Cy3, shown in orange, and counter-stained with DAPI, shown in blue. Signal intensity was maximum at 35% formamide, and was tested between 15–55% formamide. (B) The same section of Edessa n. sp. 1 midgut ceca, hybridized with the Sibaria-symbiont specific probe, labeled with Cy3, shown in orange, and counter-stained with DAPI, shown in blue. Note a lack of positive fluorescent signal. (C) FISH microscopy of a section through the midgut ceca of Sibaria englemani, embedded in, and then removed from, Steedman's wax prior to hybridization, with the Sibaria-specific probe labeled with Cy3, shown in orange, and counter-stained with DAPI, shown in blue. Signal intensity was maximum at 25% formamide, and was tested between 15–55% formamide. (D) The same section of S. englemani midgut ceca, hybridized with the Edessa-symbiont specific probe, labeled with Cy3, shown in orange, and counter-stained with DAPI, shown in blue. Note a lack of positive fluorescent signal. All scales = 100 μm.