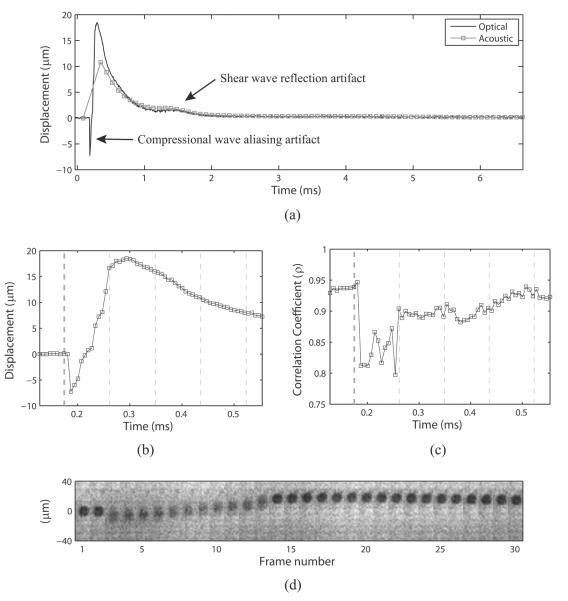
Figure 4.
(a) Example of displacement profiles tracked optically and acoustically in the 30.2 kPa phantom with an F/1.5 ARF pulse focal configuration. Note two anomalous displacements: a broad, low displacement occurring at ~1.5 msec corresponding to a shear wave reflection off the proximal phantom boundary, and a sharp, negative displacement occurring before the first acoustically tracked point at ~0.19 msec corresponding to aliased compressional motion from the high frequency 300 cycle ARF pulse. (b) Zoomed in version of the optical displacement vs. time trace. (c) Zoomed in time scale showing the maximum correlation coefficients calculated for each optical time point. Vertical lines in both (b) and (c) depict timing of acoustic pulses: thicker black line indicates the ARF pulse, while thinner black lines indicate tracking pulses. (d) Filmstrip showing the camera frames over time. Note that the bead appears blurry while the ARF pulse oscillates the bead at the carrier frequency (4.21 MHz) in frames 3–13. During this time, the correlation coefficient of optical tracking drops significantly (c), and a negative displacement artifact appears in the optical trace (b).

