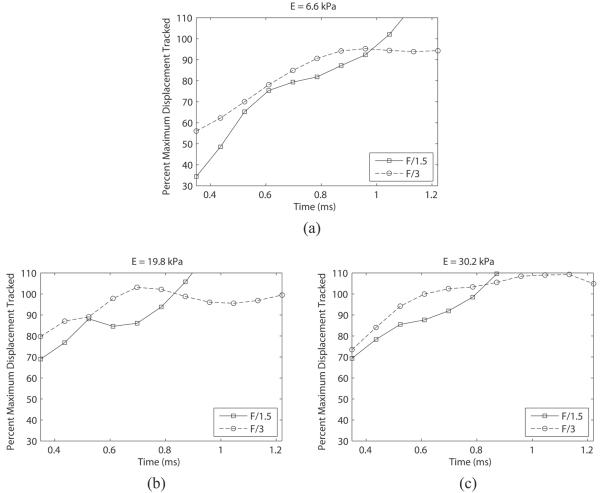
Figure 6.
Percentage of optical displacement tracked acoustically in phantoms of 6.6 kPa (a), 19.8 kPa (b), and 30.2 kPa (c) with two different excitation pulse focal configurations (F/1.5 and F/3). The tracking transmit pulse focal configuration was F/1.5 for all cases. Note that the F/1.5 excitation results in a larger displacement underestimation at the early time points. Percentage values were calculated from the mean displacement values at each time point in Figure 5.

