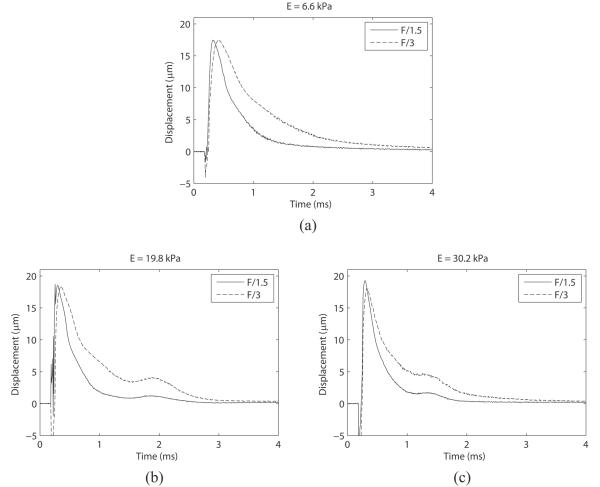
Figure 7.
Mean optically traced displacements with F/1.5 and F/3 ARF pulse focal configurations plotted on top of each other to show the effect of pushing F/# on phantom recovery time. In each phantom, time to 67% recovery of maximum displacement and time to peak is elongated when a less focused pushing pulse is utilized.

