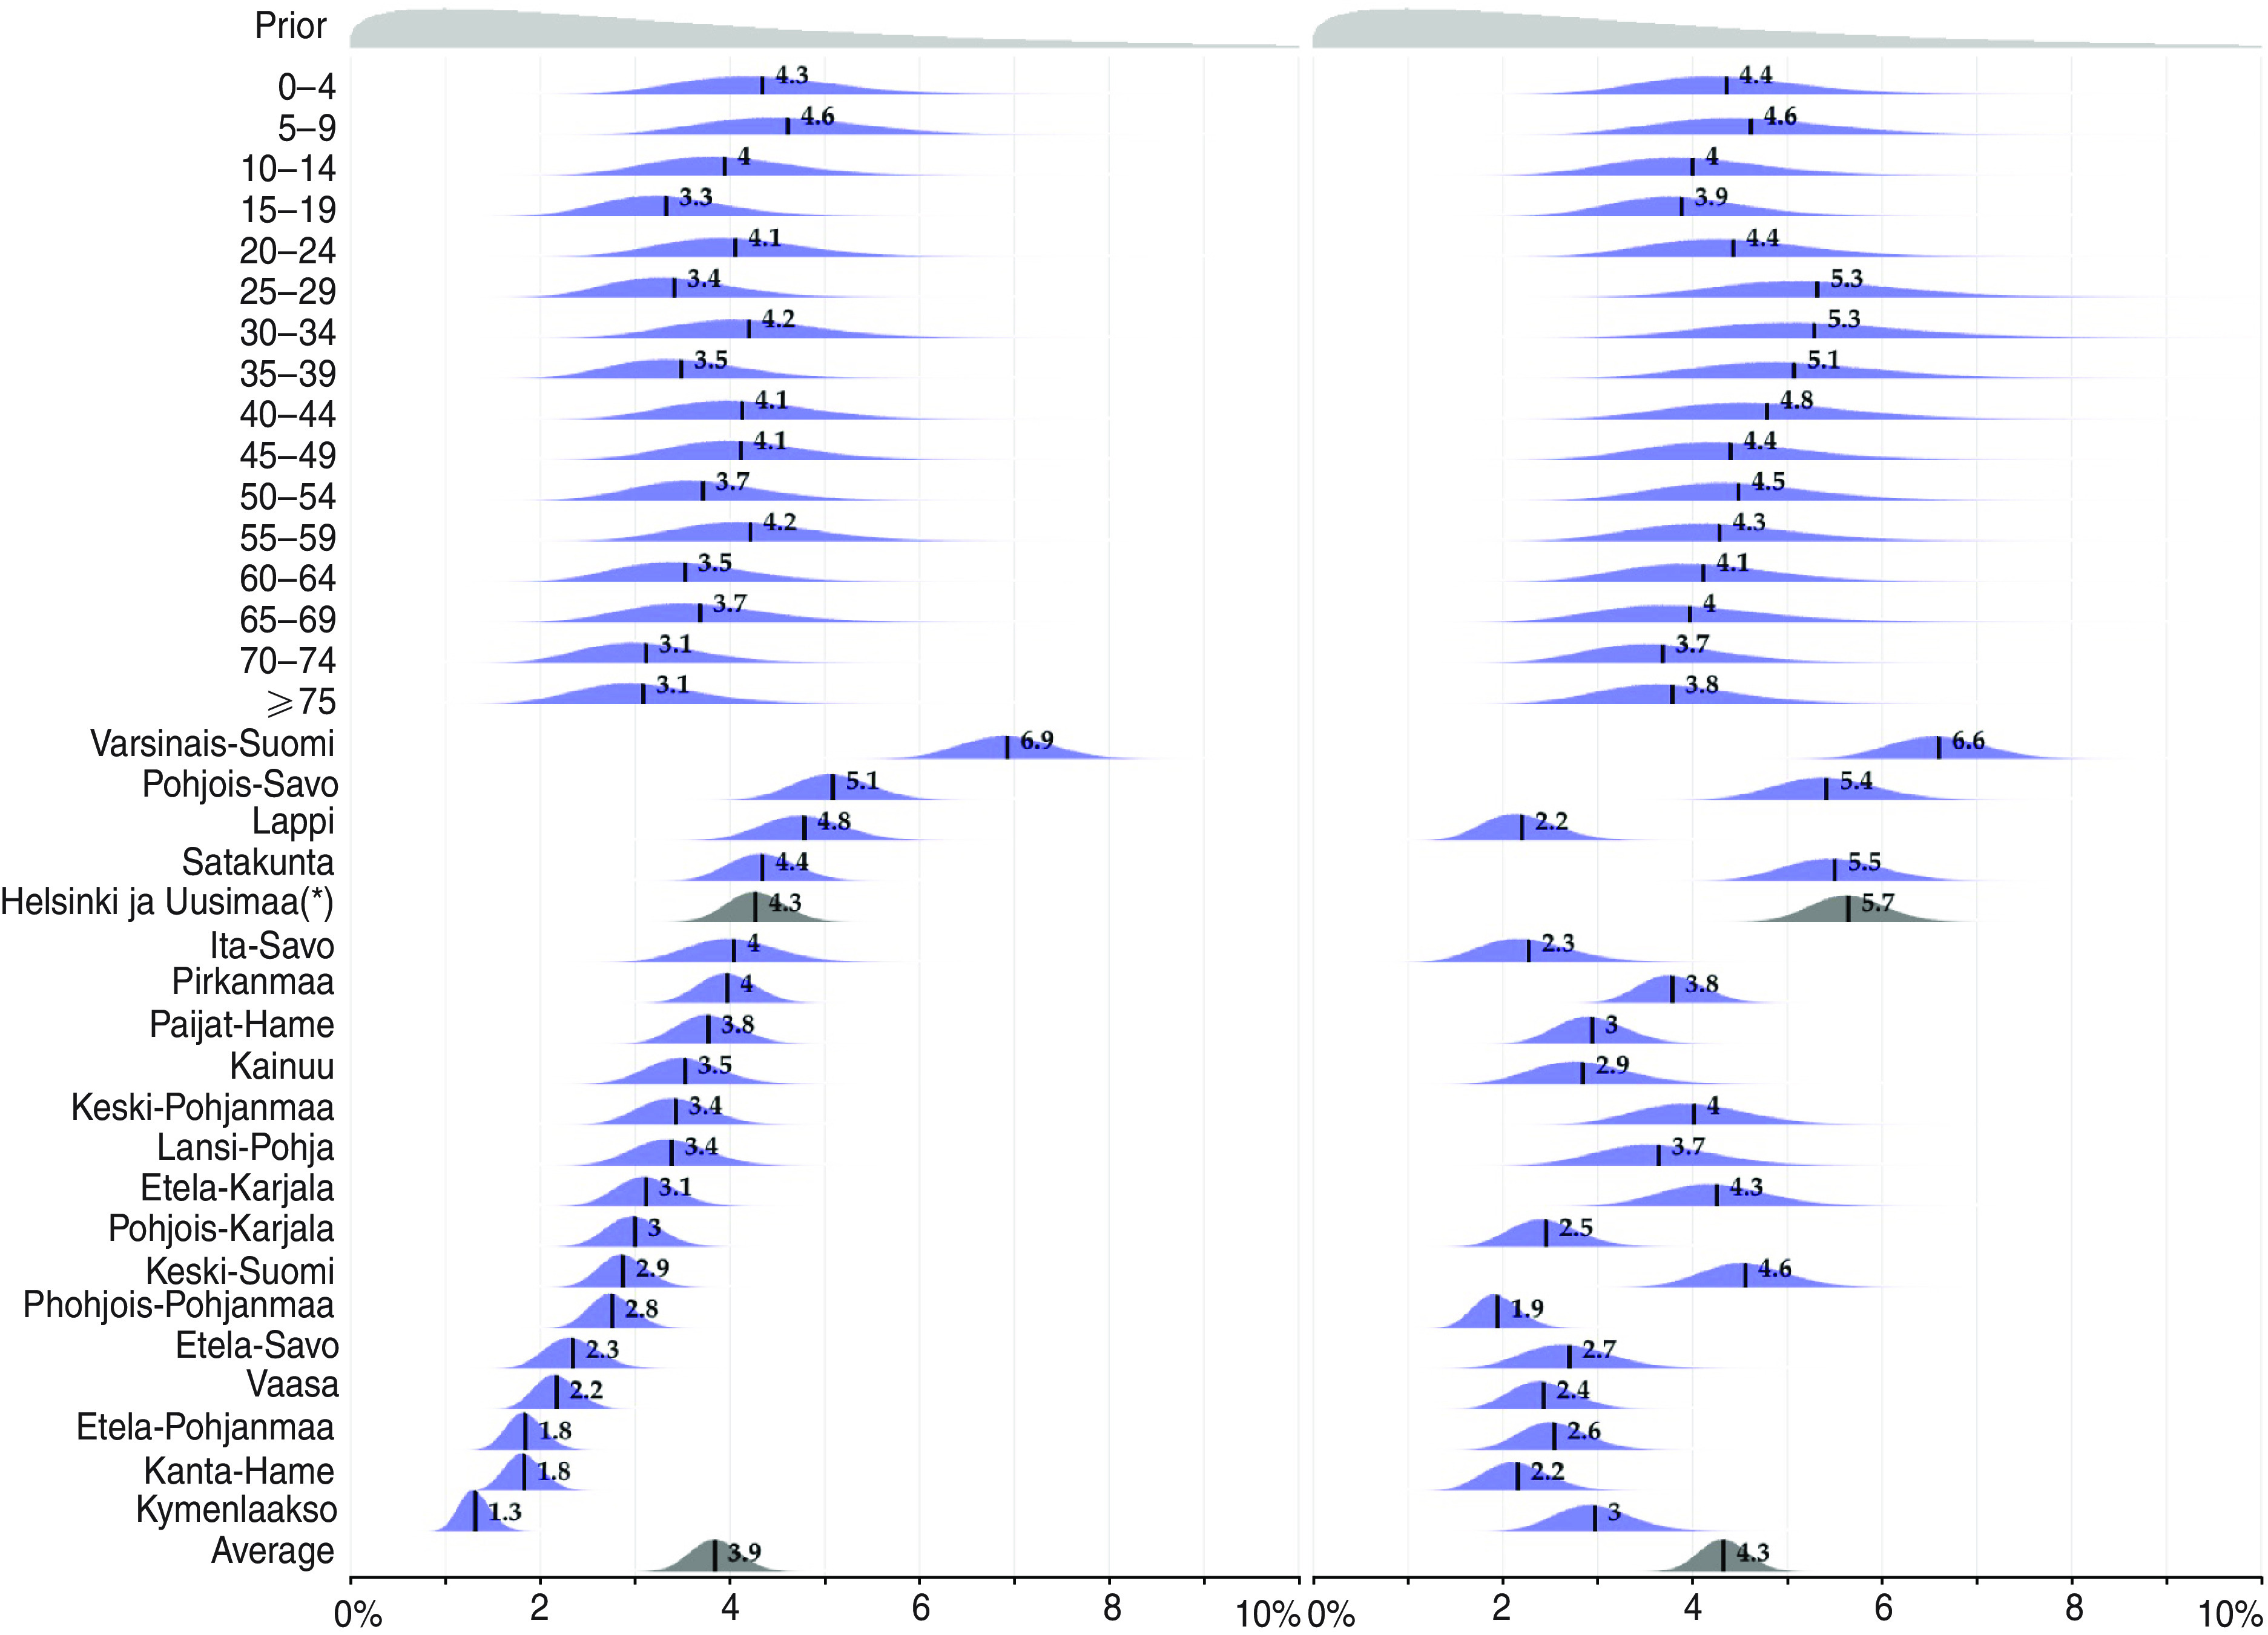
Fig. 4.

[colour online]. The ascertainment probability. The posterior distribution of the ascertainment probability for mild cases αM by age group and region. The posterior mean values are highlighted. The order of the regions is arbitrary. Helsinki and Uusimaa(*), i.e. the capital region, contains 28% of the population.
