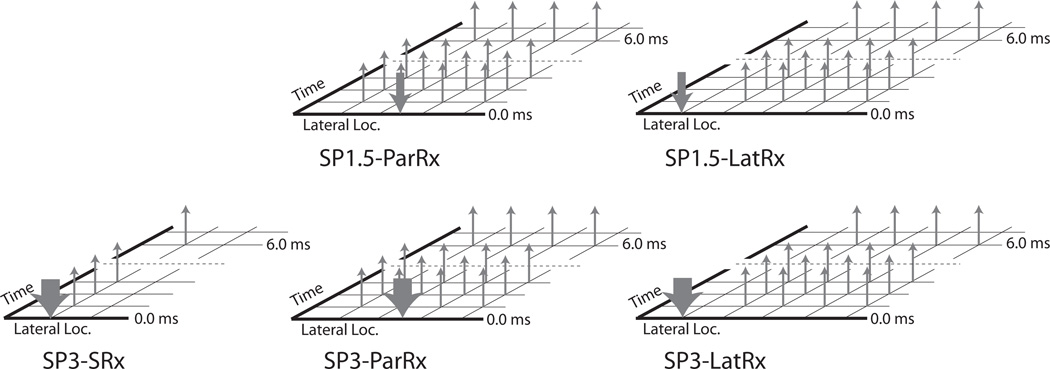
Figure 2.
Diagrams of the five different ARFI beam sequences that were investigated in this study. Downward arrows represent excitation beams, while upward arrows represent tracking beams. The width of the downward arrows signifies the focal configuration (F/#), with the narrow arrows representing F/1.5 and the wide arrows representing F/3. Figures are not drawn to scale.

