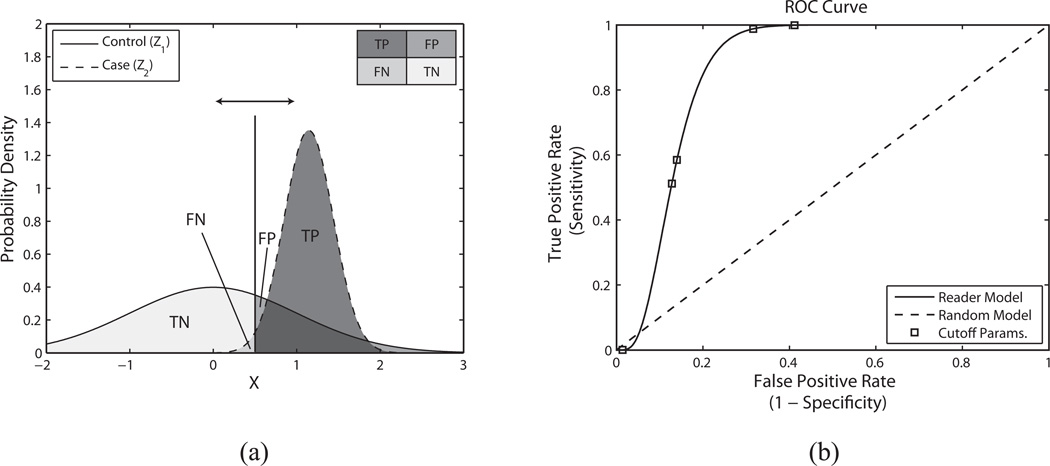
Figure A1.
(a) Estimated normal distributions representing the variables “control” (Z1) and “case” (Z2) which depict Reader 5’s responses for lipid pools using SP3-ParRx. For the Z1 distribution, the mean (µ1) and standard deviation (σ1) were assumed to be 0 and 1 respectively. For the Z2 distribution the mean and standard deviation were estimated by maximum likelihood estimation (MLE) as follows; µ̂2 = 4.52 and σ̂2 = 2.57. The vertical line represents one possible decision threshold and the corresponding regions of the two distributions are labeled accordingly (TN – true negative, FN – false negative, FP – false positive, TP – true positive). An ROC curve is computed by sliding the decision threshold along the X-axis to compute both false positive rate (FPR) and true positive rate (TPR). (b) Corresponding ROC curve depicting Reader 5’s performance using beam sequence SP3-ParRx to identify lipid pools. The result for the reader is depicted as a solid line, while the result for a random classifier is depicted as a dashed line. The discrete operating points (estimated with MLE) are depicted as square boxes plotted on top of the reader curve. In this case, the area under the curve is 0.95.

