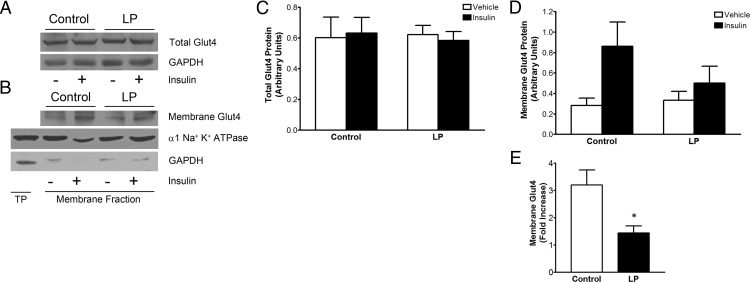
Figure 6.
Insulin-induced membrane localization of Glut4 is less efficient in LP. A, Representative blots showing bands for total Glut4 along with GAPDH (loading control). B, Blot showing membrane Glut4 and the α subunit of Na+,K+-ATPase (loading control) along with GAPDH (cytoplasmic marker). TP, total protein. C and D, Densitometric analysis for total Glut4 (C) and membrane Glut4 (D), showing their levels in control and LP rats in the presence or absence of insulin. Values were normalized with the loading controls, GAPDH for total Glut4 and the α subunit of Na+,K+ ATPase for membrane Glut4. (E) Plot showing the fold increase of membrane Glut4 in response to insulin treatment in controls and LP rats. Results are presented as means ± SEM (n = 3–5/group) *, P < .05.

