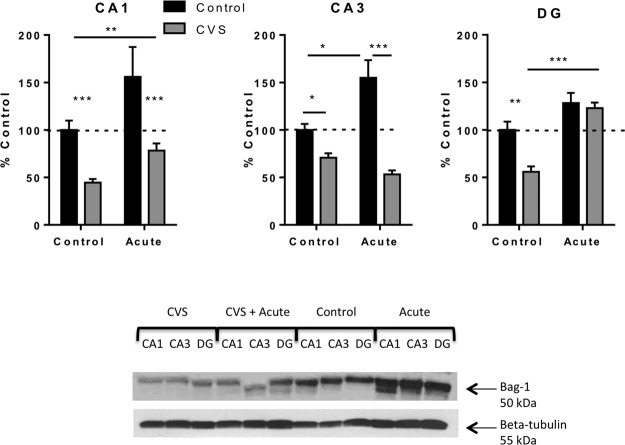
Figure 5.
Regulation of BAG-1 protein expression in the hippocampus. This figure shows quantification and representative Western blots of BAG-1 relative to beta tubulin protein from the hippocampus of control, acute stress only, CVS, and CVS plus novel acute stress animals. CVS resulted in a significant decrease in BAG-1 protein relative to beta tubulin protein in all three regions of the hippocampus compared with control rats. CVS plus novel acute stress resulted in a significant increase of BAG-1 in the CA1 and DG of the hippocampus compared with CVS animals and a significant decrease in the CA3 compared with control animals. Data are shown as means ± SE; *, P < .05; **, P < .01; ***, P < .001 (n = 4 animals per group).

