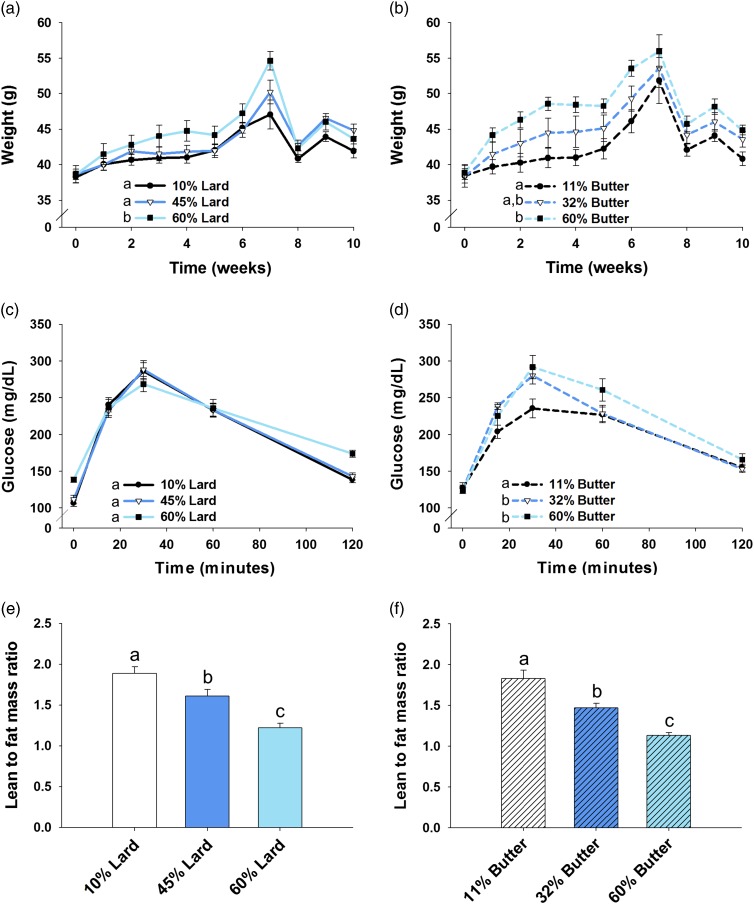
Fig. 1.
Dam body weight, glucose tolerance and body composition. Body weight (a, b) for dams that weaned litters is shown. Weight was increased in both 60% lard and 60% butter high-fat diet-fed animals compared with their respective control group (n=11–17 for lard, n=10–16 for butter). Glucose tolerance was not significantly impaired in lard animals (c) the week before mating, but glucose disposal was impaired in both 32 and 60% butter animals (d) (n=16 per group). Lean to fat mass ratio was decreased in an incremental fashion before mating for both 45 and 60% lard (e) and 32 and 60% butter females (f) (n=20 per group). Groups not sharing a common letter (‘a’, ‘b’ or ‘c’) in the legend of the graph or on the graph itself are significantly different. Error bars indicate s.e.m.

