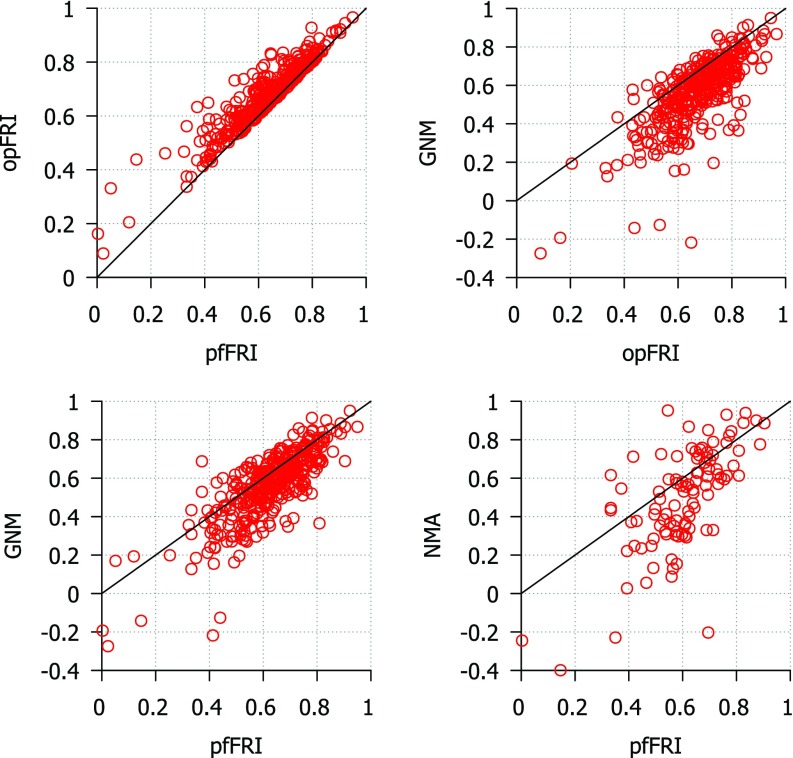
FIG. 3.
Comparison of correlation coefficients from B-factor prediction using GNM, coarse-grained (Cα) NMA and FRI methods. Top left: pfFRI vs opFRI for 365 proteins; top right: opFRI vs GNM for 365 proteins; bottom left: pfFRI vs GNM for 365 proteins; bottom right: pfFRI vs NMA for three sets of proteins used by Park et al.28 The correlation coefficients for NMA are adopted from Park et al.28 for three sets of proteins. For optimal FRI, parameter υ is optimized for a range from 0.1 to 10.0. For the parameter free version of the FRI (pfFRI), we set υ = 3 and η = 3 Å. The line y = x is included to aid in comparing scores.

