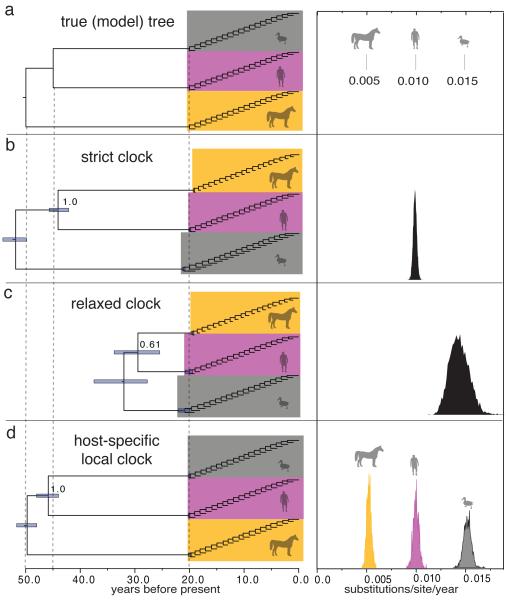
Figure 1. Performance of different clock models on simulated data.
a, Model tree used to simulate nucleotide data, with branch lengths depicted in units of time. The host-specific rates of the ‘equine’, ‘human’, and ‘avian’ lineages are shown to the right of the tree. b, MCC tree for simulation replicate #1 under a strict clock model. The 95% credibility interval for each node time is shown with a bar, and the posterior probability of the ingroup node is indicated. c, MCC tree under a relaxed clock model. d, MCC tree under the HSLC model. The posterior density of the clock rate inferred under each model is shown at right. Summaries of the results for all 100 replicates are shown in Extended Data Fig. 1.

