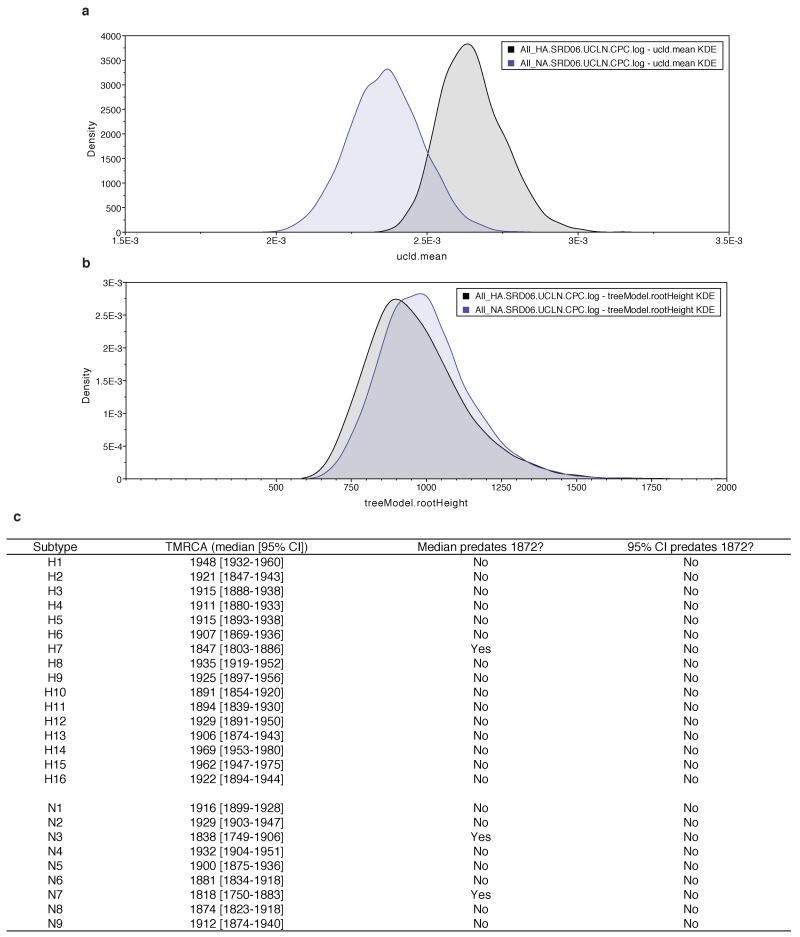
Extended Data Figure 7. HA and NA genetic diversity analysis rates and dates (from Fig. 3).
a, Posterior density of substitution rates of HA and NA. b, Posterior density of TMRCA of all HA subtype and all NA subtypes. c, Within-subtype TMRCAs for each HA and NA subtype.

