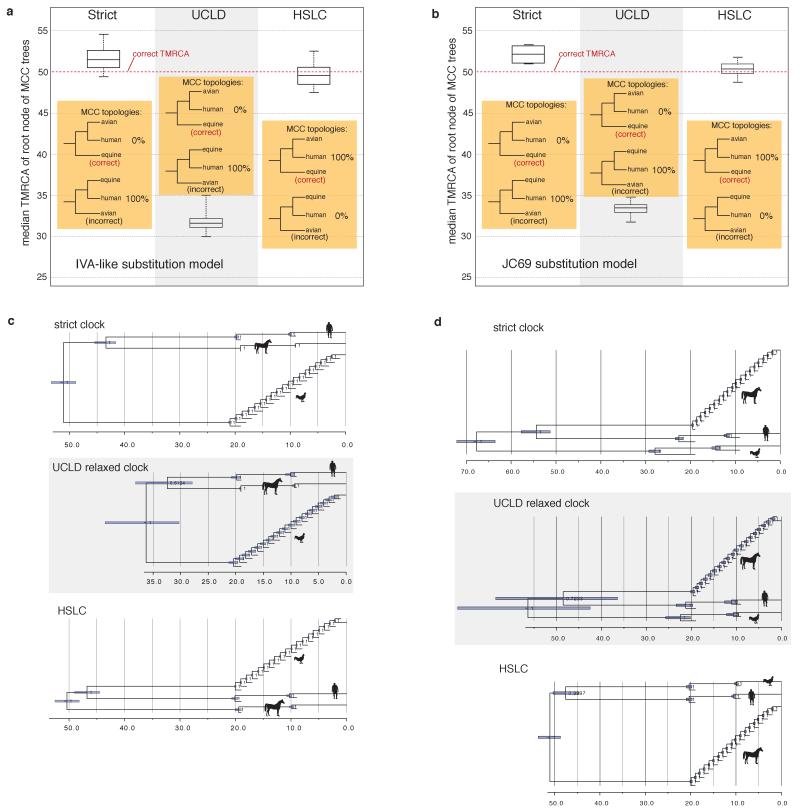
Extended Data Figure 1. Performance of different clock models on simulated data.
a, Summary of the 100 replicates corresponding to Fig. 1 (IVA-like substitution model). The box plots represent the median, Q1, Q3, minimum, and maximum of the 100 median TMRCA estimates. The HSLC model recovered the ‘correct’ (model) tree topology in 100% of the simulations; the other models did so in 0%. With the relaxed clock the 95% CI for the TMRCA never included the real root node date, while the HSLC model did in 91% of the simulations. b, Summary of 10 otherwise similar replicates, but simulated under a JC69 substitution model. c, Simulation with unequal sampling across clades, with ‘fast’ clade (‘avian’) sequences over-represented. (The model tree was identical to that in Fig. 1a except for the unequal number of sequences from the different clades as shown.) d, Simulation with ‘slow’ clade (‘equine’) sequences over-represented. Unlike the HSLC model, root date estimates are systematically biased under both strict and relaxed clock models and are strongly influenced by the balance of ‘fast-clade’ and ‘slow-clade’ sequences sampled.

