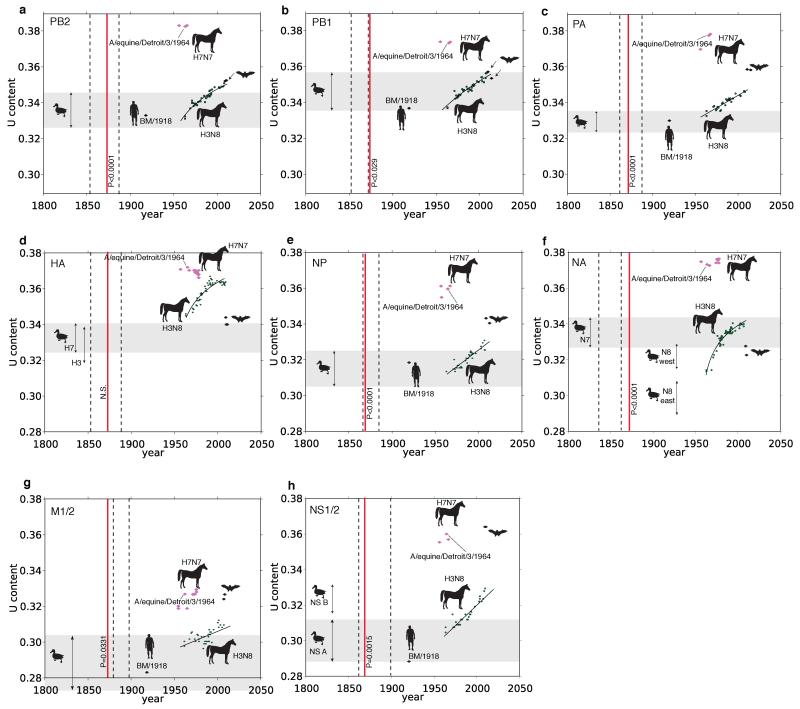
Extended Data Figure 4. Uracil content patterns.
a-h, U content patterns for PB2, PB1, PA, HA, NP, NA, M1/2, and NS1/2, respectively. The 95% CI of avian U content is shown for each segment with a gray rectangle. U content versus year of sampling is shown by black diamond symbols for human H1N1 and bat H17N10, magenta diamonds for equine H7N7, and solid green circles for equine H3N8. The curves fitted to the H3N8 data are shown. The equine panzootic of 1872-1873 is depicted with a vertical red line. The left dashed line corresponds to node 1 from Fig. 2, the right dashed line, node 2. P values beside the red lines reflect the tests of whether the equine H7N7 age estimates predate 1872; for HA, NA, and NS1/2 the gray rectangle depicts the 95% confidence interval for the ingroup avian data (H7, N7, and NS1/2 A lineage, respectively). Avian H3, N8, and NS1/2 lineage B U content distributions are indicated with separate arrow lines. The estimated origin dates of the equine H7N7 genes based on U content values were: PB2 1548[1533-1574]; PB1 1842[1816-1877]; PA 1819[1795-1842]; H7 1880[1878-1884]; NP 1785[1747-1823]; N7 1387[1373-1413]; M1/2 1801[1724-1879]; NS1/2 1835[1810-1861]).

